
- Startseite >
- Flüsse >
- Wasserstand >
- Isar >
- Rottach >
- Jahresgrafik

Jahresgrafik Rottach / Rottach
Wasserstand vom 01.01.2024 bis zum 25.04.2024
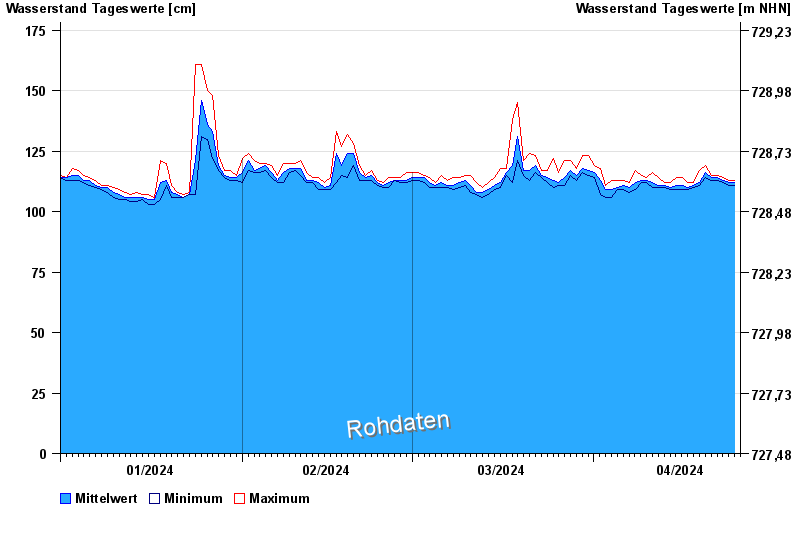
- Hochwassergefahrenfläche HQ100 270 cm
| Datum | Mittelwert [cm] | Maximum [cm] | Minimum [cm] |
|---|---|---|---|
| 25.04.2024 | 112 | 112 | 111 |
| 24.04.2024 | 112 | 113 | 111 |
| 23.04.2024 | 113 | 114 | 112 |
| 22.04.2024 | 114 | 115 | 113 |
| 21.04.2024 | 114 | 115 | 113 |
| 20.04.2024 | 116 | 119 | 114 |
| 19.04.2024 | 112 | 117 | 111 |
© Bayerisches Landesamt für Umwelt 2024