
- Startseite >
- Flüsse >
- Wasserstand >
- Isar >
- Rottach >
- Jahresgrafik

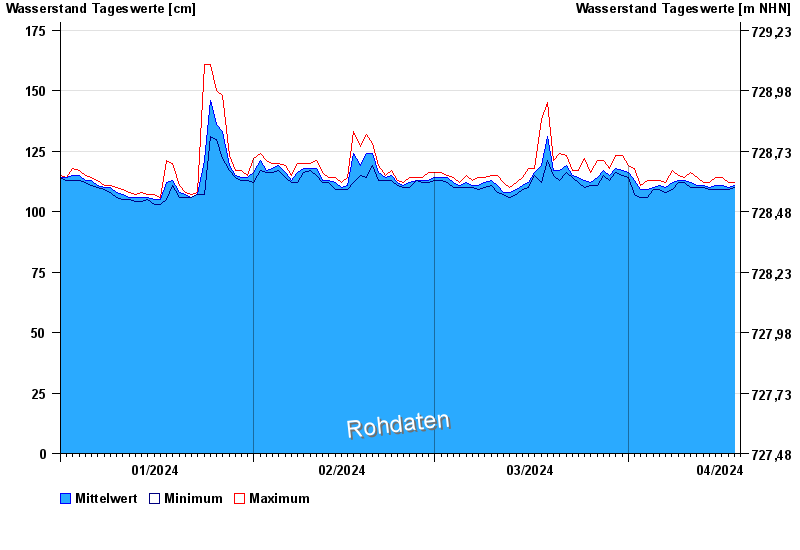
Jahresgrafik Rottach / Rottach
Wasserstand vom 01.01.2024 bis zum 18.04.2024
- 295 cm: Rottach-Egern: Oberkante des Deiches im Pegelbereich
| Datum | Mittelwert [cm] | Maximum [cm] | Minimum [cm] |
|---|---|---|---|
| 18.04.2024 | 111 | 111 | 110 |
| 17.04.2024 | 110 | 112 | 109 |
| 16.04.2024 | 111 | 114 | 109 |
| 15.04.2024 | 111 | 114 | 109 |
| 14.04.2024 | 110 | 112 | 109 |
| 13.04.2024 | 111 | 112 | 110 |
| 12.04.2024 | 111 | 114 | 110 |
© Bayerisches Landesamt für Umwelt 2024