
- Startseite >
- Flüsse >
- Wasserstand >
- Isar >
- Raisting >
- Jahresgrafik

Jahresgrafik Raisting / Rott
Wasserstand vom 01.01.2024 bis zum 23.04.2024
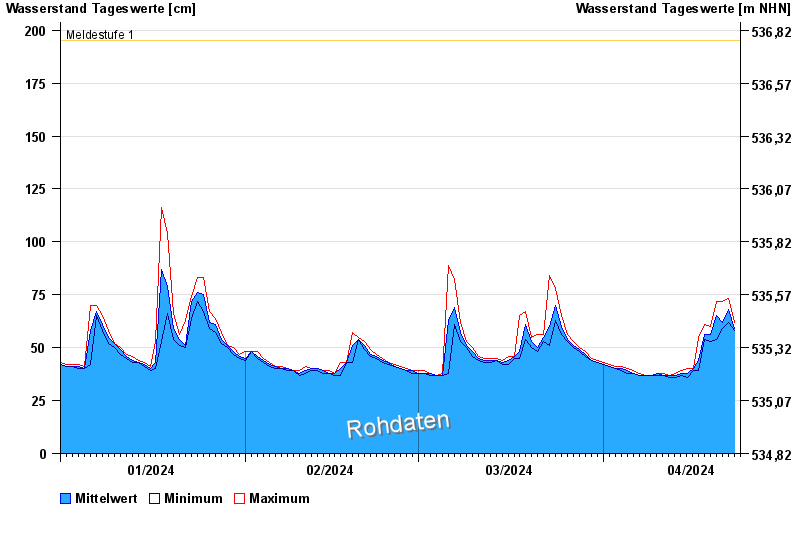
- Meldestufe 1 195 cm
- Meldestufe 2 210 cm
- Meldestufe 3 250 cm
- Meldestufe 4 290 cm
- Hochwassergefahrenfläche HQ100 340 cm
| Datum | Mittelwert [cm] | Maximum [cm] | Minimum [cm] |
|---|---|---|---|
| 23.04.2024 | 59 | 62 | 58 |
| 22.04.2024 | 68 | 73 | 62 |
| 21.04.2024 | 62 | 72 | 59 |
| 20.04.2024 | 65 | 72 | 54 |
| 19.04.2024 | 56 | 60 | 53 |
| 18.04.2024 | 56 | 61 | 54 |
| 17.04.2024 | 44 | 55 | 39 |
© Bayerisches Landesamt für Umwelt 2024