
- Startseite >
- Flüsse >
- Wasserstand >
- Isar >
- Prien >
- Jahresgrafik

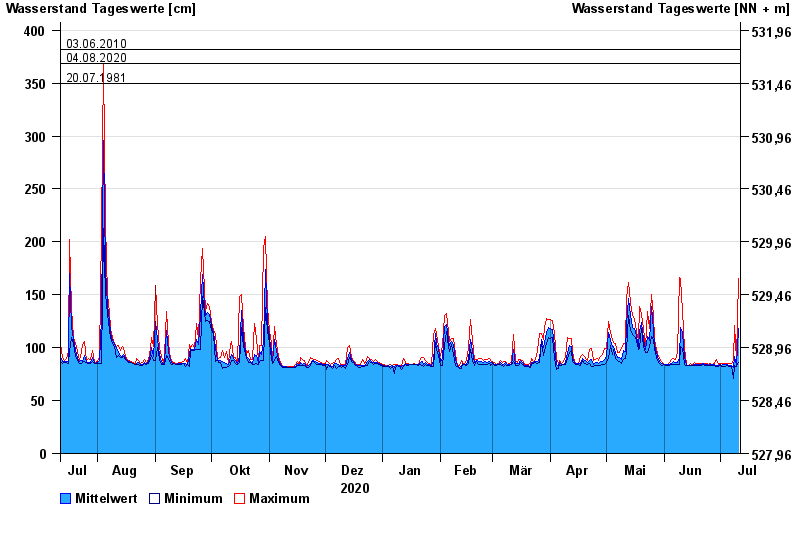
Jahresgrafik Prien / Prien
Wasserstand vom 12.07.2020 bis zum 11.07.2021
- 02.06.2013 Wasserstand: 422 cm
- 12.08.2002 Wasserstand: 419 cm
- 03.06.2010 Wasserstand: 382 cm
- 04.08.2020 Wasserstand: 369 cm
- 20.07.1981 Wasserstand: 350 cm
| Datum | Mittelwert [cm] | Maximum [cm] | Minimum [cm] |
|---|---|---|---|
| 11.07.2021 | 118 | 165 | 86 |
| 10.07.2021 | 83 | 89 | 82 |
| 09.07.2021 | 92 | 121 | 83 |
| 08.07.2021 | 81 | 88 | 71 |
| 07.07.2021 | 83 | 85 | 82 |
| 06.07.2021 | 83 | 85 | 82 |
| 05.07.2021 | 84 | 85 | 83 |
© Bayerisches Landesamt für Umwelt 2024