
- Startseite >
- Flüsse >
- Wasserstand >
- Isar >
- Plattling >
- Jahresgrafik

Jahresgrafik Plattling / Isar
Wasserstand vom 31.07.2020 bis zum 30.07.2021
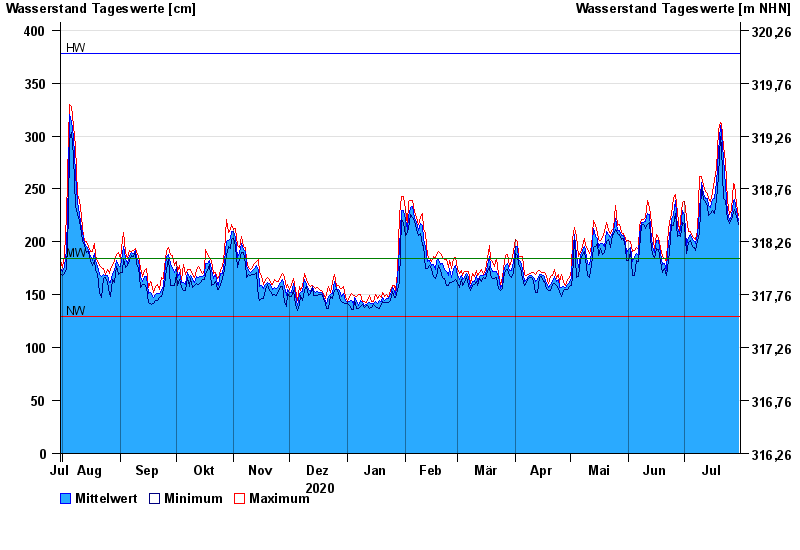
| Datum | Mittelwert [cm] | Maximum [cm] | Minimum [cm] |
|---|---|---|---|
| 30.07.2021 | 220 | 225 | 216 |
| 29.07.2021 | 230 | 235 | 224 |
| 28.07.2021 | 240 | 254 | 231 |
| 27.07.2021 | 238 | 255 | 228 |
| 26.07.2021 | 225 | 231 | 221 |
| 25.07.2021 | 220 | 226 | 217 |
| 24.07.2021 | 228 | 239 | 221 |
© Bayerisches Landesamt für Umwelt 2024