
- Startseite >
- Flüsse >
- Wasserstand >
- Isar >
- Oberhausen >
- Jahresgrafik

Jahresgrafik Oberhausen / Ach
Wasserstand vom 24.01.2022 bis zum 23.01.2023
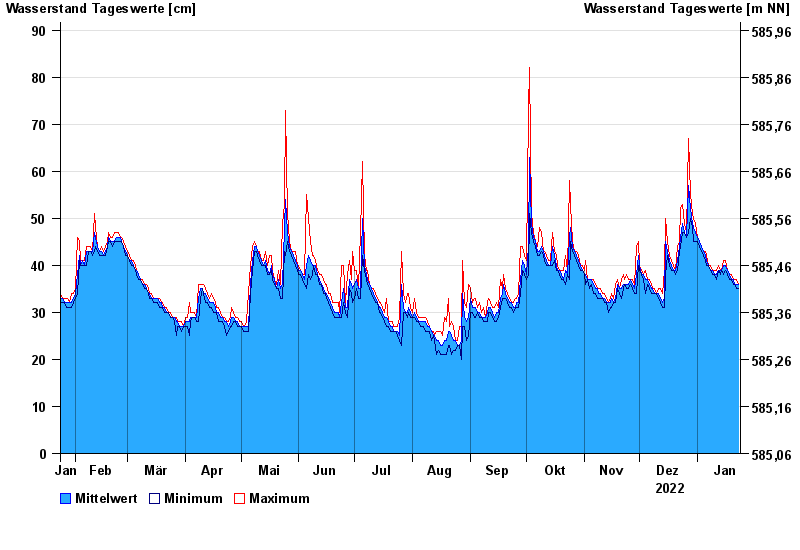
- Hochwassergefahrenfläche HQ100 236 cm
| Datum | Mittelwert [cm] | Maximum [cm] | Minimum [cm] |
|---|---|---|---|
| 23.01.2023 | 36 | 36 | 35 |
| 22.01.2023 | 36 | 37 | 35 |
| 21.01.2023 | 36 | 37 | 36 |
| 20.01.2023 | 37 | 37 | 36 |
| 19.01.2023 | 37 | 38 | 37 |
| 18.01.2023 | 38 | 38 | 37 |
| 17.01.2023 | 39 | 39 | 38 |
© Bayerisches Landesamt für Umwelt 2024