
- Startseite >
- Flüsse >
- Wasserstand >
- Isar >
- Mühlau >
- Monatsgrafik

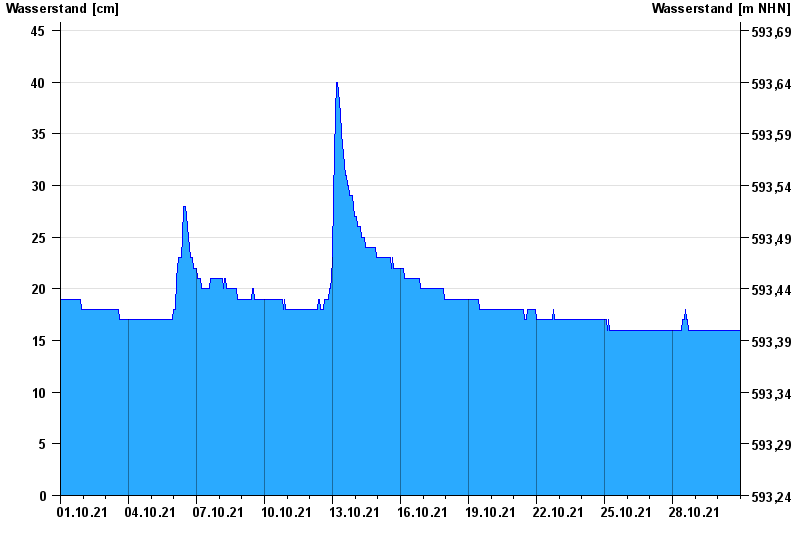
Monatsgrafik Mühlau / Mühlbach
Wasserstand vom 01.10.2021 bis zum 30.10.2021
- Hochwassergefahrenfläche HQhäufig 100 cm
| Datum | Wasserstand [cm] |
|---|---|
| 31.10.2021 00:45 | 15 |
| 31.10.2021 00:30 | 16 |
| 31.10.2021 00:15 | 16 |
| 31.10.2021 00:00 | 16 |
| 30.10.2021 23:45 | 16 |
| 30.10.2021 23:30 | 15 |
| 30.10.2021 23:15 | 16 |
© Bayerisches Landesamt für Umwelt 2024