
- Startseite >
- Flüsse >
- Wasserstand >
- Isar >
- Hochberg >
- Jahresgrafik

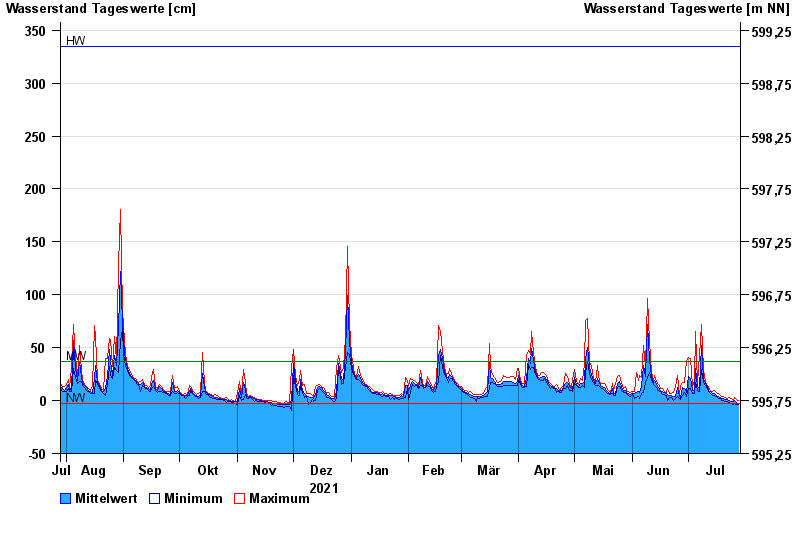
Jahresgrafik Hochberg / Traun
Wasserstand vom 29.07.2021 bis zum 28.07.2022
| Datum | Mittelwert [cm] | Maximum [cm] | Minimum [cm] |
|---|---|---|---|
| 28.07.2022 | -3 | -- | -4 |
| 27.07.2022 | -2 | 1 | -4 |
| 26.07.2022 | -- | 3 | -3 |
| 25.07.2022 | -1 | -- | -4 |
| 24.07.2022 | -1 | 2 | -3 |
| 23.07.2022 | -- | 3 | -2 |
| 22.07.2022 | 1 | 2 | -1 |
© Bayerisches Landesamt für Umwelt 2024