
- Startseite >
- Flüsse >
- Wasserstand >
- Isar >
- Garmisch u. d. Partnachmündung >
- Jahresgrafik

Jahresgrafik Garmisch u. d. Partnachmündung / Loisach
Wasserstand vom 25.01.2021 bis zum 24.01.2022
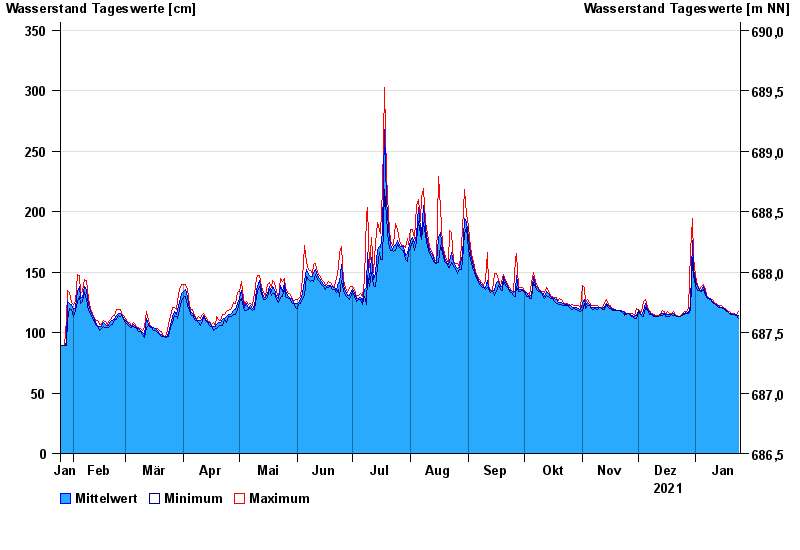
Hinweis
Messwerte beeinflusst durch Kraftwerkssteuerungen.
- 22.05.1999 Wasserstand: 410 cm
- 31.05.1940 Wasserstand: 408 cm
- 23.08.1937 Wasserstand: 408 cm
- 23.08.2005 Wasserstand: 374 cm
- 11.06.1965 Wasserstand: 362 cm
| Datum | Mittelwert [cm] | Maximum [cm] | Minimum [cm] |
|---|---|---|---|
| 24.01.2022 | 114 | 117 | 112 |
| 23.01.2022 | 115 | 115 | 114 |
| 22.01.2022 | 115 | 116 | 115 |
| 21.01.2022 | 115 | 116 | 115 |
| 20.01.2022 | 116 | 116 | 115 |
| 19.01.2022 | 116 | 117 | 116 |
| 18.01.2022 | 117 | 118 | 117 |
© Bayerisches Landesamt für Umwelt 2024