
- Startseite >
- Flüsse >
- Wasserstand >
- Isar >
- Garmisch u. d. Partnachmündung >
- Jahresgrafik

Jahresgrafik Garmisch u. d. Partnachmündung / Loisach
Wasserstand vom 08.10.2022 bis zum 07.10.2023
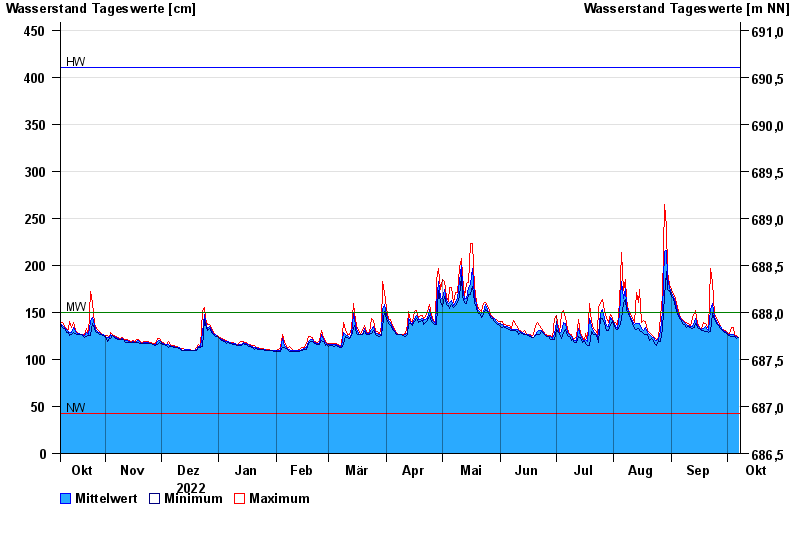
Hinweis
Messwerte beeinflusst durch Kraftwerkssteuerungen.
| Datum | Mittelwert [cm] | Maximum [cm] | Minimum [cm] |
|---|---|---|---|
| 07.10.2023 | 123 | 123 | 123 |
| 06.10.2023 | 124 | 125 | 122 |
| 05.10.2023 | 125 | 126 | 124 |
| 04.10.2023 | 127 | 134 | 124 |
| 03.10.2023 | 126 | 134 | 124 |
| 02.10.2023 | 126 | 128 | 125 |
| 01.10.2023 | 128 | 129 | 127 |
© Bayerisches Landesamt für Umwelt 2024