
- Startseite >
- Flüsse >
- Wasserstand >
- Isar >
- Garmisch u. d. Partnachmündung >
- Jahresgrafik

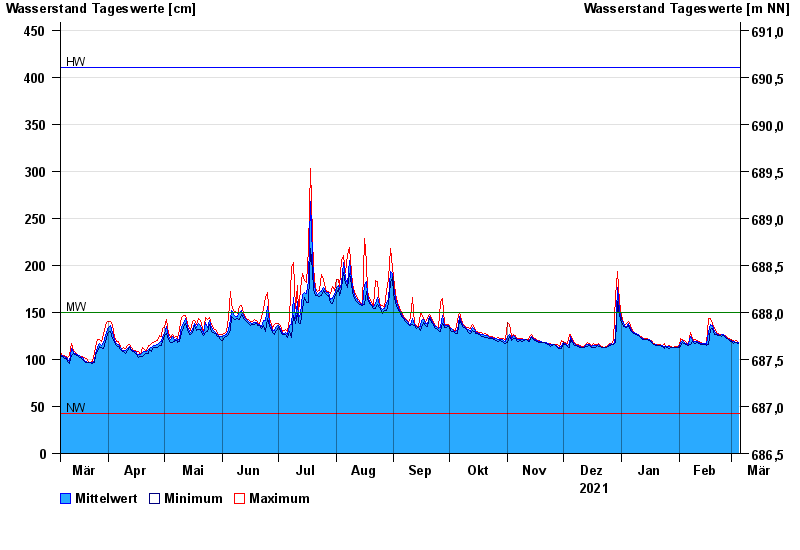
Jahresgrafik Garmisch u. d. Partnachmündung / Loisach
Wasserstand vom 06.03.2021 bis zum 05.03.2022
Hinweis
Messwerte beeinflusst durch Kraftwerkssteuerungen.
| Datum | Mittelwert [cm] | Maximum [cm] | Minimum [cm] |
|---|---|---|---|
| 05.03.2022 | 118 | 118 | 117 |
| 04.03.2022 | 118 | 120 | 118 |
| 03.03.2022 | 119 | 119 | 118 |
| 02.03.2022 | 119 | 120 | 117 |
| 01.03.2022 | 120 | 121 | 119 |
| 28.02.2022 | 121 | 122 | 120 |
| 27.02.2022 | 122 | 123 | 122 |
© Bayerisches Landesamt für Umwelt 2024