
- Startseite >
- Flüsse >
- Wasserstand >
- Isar >
- Eschenlohe Brücke >
- Jahresgrafik

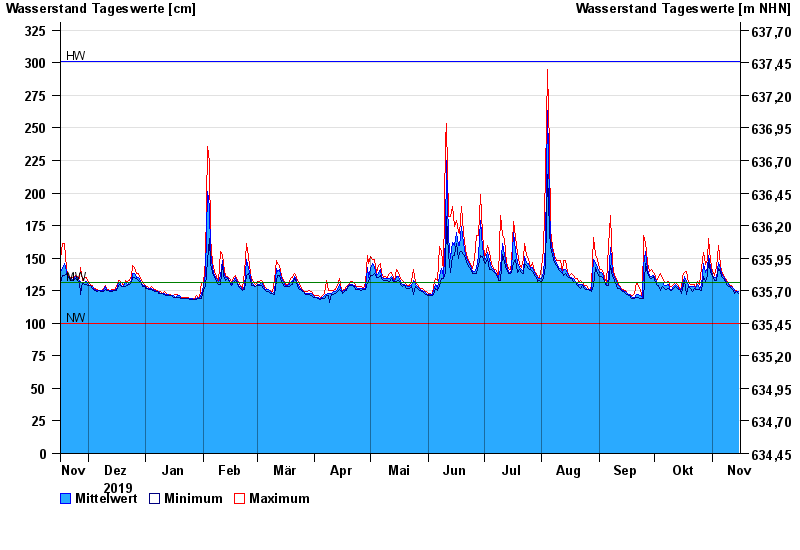
Jahresgrafik Eschenlohe Brücke / Loisach
Wasserstand vom 16.11.2019 bis zum 15.11.2020
Hinweis
Messwerte beeinflusst durch Kraftwerkssteuerungen.
| Datum | Mittelwert [cm] | Maximum [cm] | Minimum [cm] |
|---|---|---|---|
| 15.11.2020 | 124 | 124 | 123 |
| 14.11.2020 | 124 | 125 | 124 |
| 13.11.2020 | 125 | 126 | 123 |
| 12.11.2020 | 127 | 127 | 125 |
| 11.11.2020 | 128 | 129 | 127 |
| 10.11.2020 | 129 | 130 | 128 |
| 09.11.2020 | 131 | 132 | 129 |
© Bayerisches Landesamt für Umwelt 2024