
- Startseite >
- Flüsse >
- Wasserstand >
- Isar >
- Bad Trißl >
- Jahresgrafik

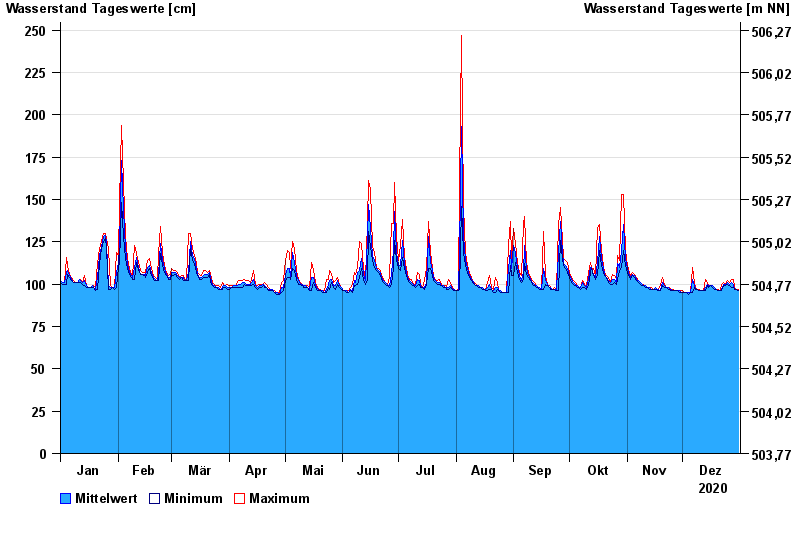
Jahresgrafik Bad Trißl / Auerbach
Wasserstand vom 01.01.2020 bis zum 31.12.2020
 Für diesen Pegel sind keine Meldestufen hinterlegt.
| Datum | Mittelwert [cm] | Maximum [cm] | Minimum [cm] |
|---|---|---|---|
| 31.12.2020 | 96 | 97 | 96 |
| 30.12.2020 | 97 | 97 | 97 |
| 29.12.2020 | 97 | 98 | 97 |
| 28.12.2020 | 100 | 103 | 98 |
| 27.12.2020 | 101 | 103 | 98 |
| 26.12.2020 | 100 | 101 | 99 |
| 25.12.2020 | 101 | 102 | 100 |
© Bayerisches Landesamt für Umwelt 2024