
- Startseite >
- Flüsse >
- Wasserstand >
- Isar >
- Bad Aibling >
- Jahresgrafik

Jahresgrafik Bad Aibling / Glonn
Wasserstand vom 18.10.2023 bis zum 17.10.2024
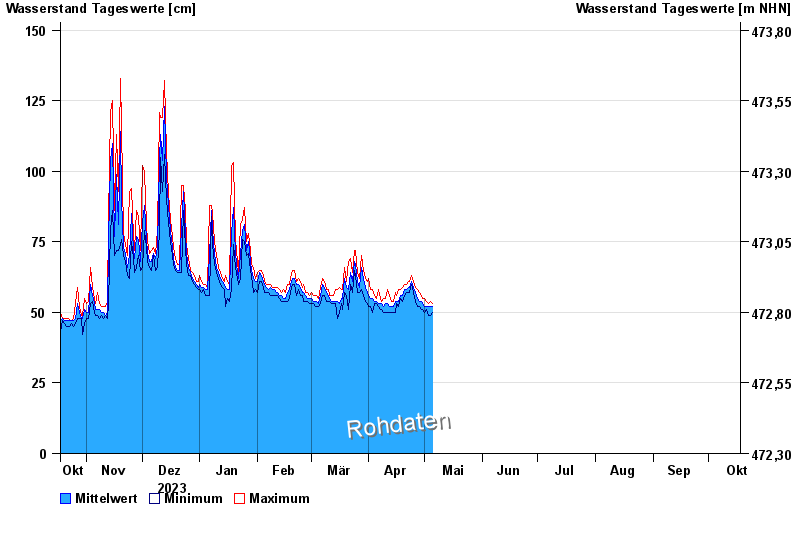
- Hochwassergefahrenfläche HQ100 290 cm
| Datum | Mittelwert [cm] | Maximum [cm] | Minimum [cm] |
|---|---|---|---|
| 25.04.2024 | 59 | 61 | 57 |
| 24.04.2024 | 61 | 63 | 60 |
| 23.04.2024 | 59 | 61 | 57 |
| 22.04.2024 | 59 | 61 | 57 |
| 21.04.2024 | 58 | 60 | 57 |
| 20.04.2024 | 58 | 60 | 56 |
| 19.04.2024 | 56 | 59 | 54 |
© Bayerisches Landesamt für Umwelt 2024