
- Startseite >
- Flüsse >
- Wasserstand >
- Inn >
- Wasserburg >
- Jahresgrafik

Jahresgrafik Wasserburg / Inn
Wasserstand vom 01.01.2024 bis zum 23.04.2024
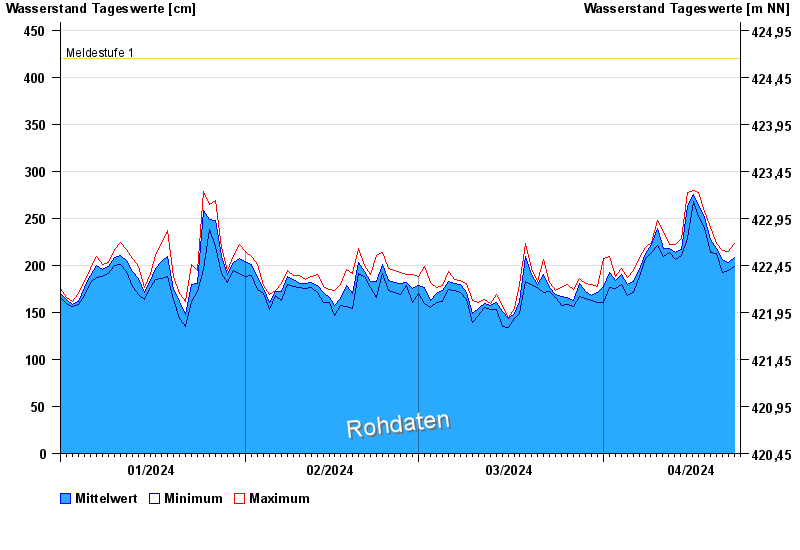
- Meldestufe 1 420 cm
- Meldestufe 2 500 cm
- Meldestufe 3 550 cm
- Meldestufe 4 600 cm
- Hochwassergefahrenfläche HQ100 700 cm
| Datum | Mittelwert [cm] | Maximum [cm] | Minimum [cm] |
|---|---|---|---|
| 23.04.2024 | 216 | 223 | 208 |
| 22.04.2024 | 203 | 215 | 195 |
| 21.04.2024 | 206 | 216 | 192 |
| 20.04.2024 | 218 | 223 | 213 |
| 19.04.2024 | 227 | 240 | 214 |
| 18.04.2024 | 251 | 257 | 240 |
| 17.04.2024 | 264 | 277 | 252 |
© Bayerisches Landesamt für Umwelt 2024