
- Startseite >
- Flüsse >
- Wasserstand >
- Inn >
- Unterjettenberg >
- Jahresgrafik

Jahresgrafik Unterjettenberg / Saalach
Wasserstand vom 01.01.2024 bis zum 19.04.2024
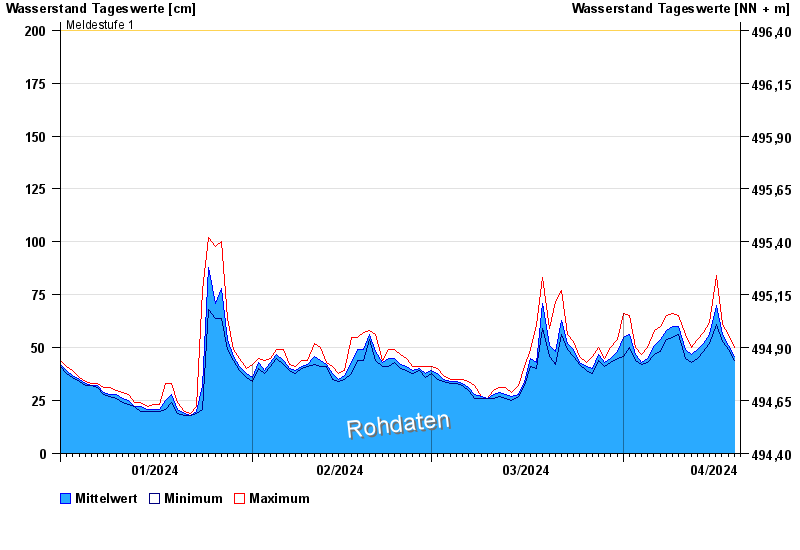
- Meldestufe 1 200 cm
- Meldestufe 2 250 cm
- Meldestufe 3 300 cm
- Meldestufe 4 350 cm
- Hochwassergefahrenfläche HQ100 430 cm
| Datum | Mittelwert [cm] | Maximum [cm] | Minimum [cm] |
|---|---|---|---|
| 19.04.2024 | 46 | 50 | 44 |
| 18.04.2024 | 51 | 56 | 49 |
| 17.04.2024 | 56 | 61 | 53 |
| 16.04.2024 | 70 | 84 | 61 |
| 15.04.2024 | 56 | 62 | 52 |
| 14.04.2024 | 52 | 57 | 48 |
| 13.04.2024 | 49 | 54 | 45 |
© Bayerisches Landesamt für Umwelt 2024