
- Startseite >
- Flüsse >
- Wasserstand >
- Inn >
- Mühldorf >
- Jahresgrafik

Jahresgrafik Mühldorf / Inn
Wasserstand vom 22.10.2019 bis zum 21.10.2020
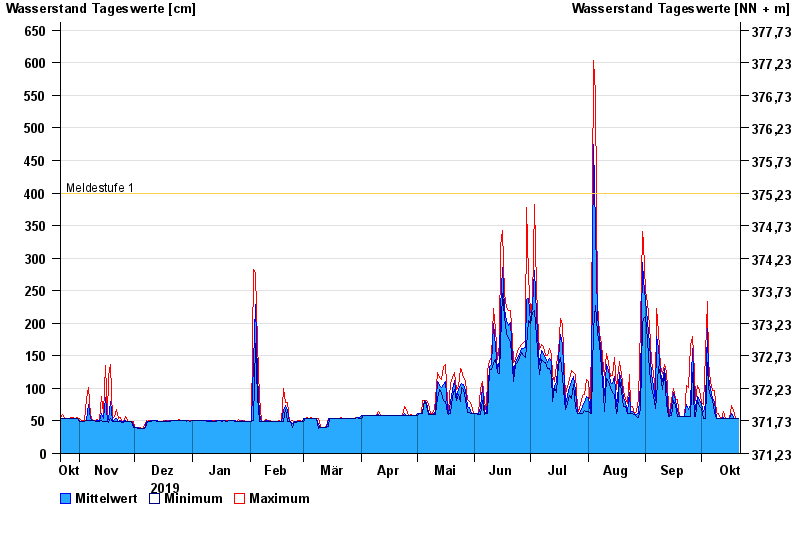
- Meldestufe 1 400 cm
- Hochwassergefahrenfläche HQ100 800 cm
| Datum | Mittelwert [cm] | Maximum [cm] | Minimum [cm] |
|---|---|---|---|
| 21.10.2020 | 53 | 53 | 53 |
| 20.10.2020 | 53 | 53 | 53 |
| 19.10.2020 | 53 | 53 | 53 |
| 18.10.2020 | 56 | 66 | 53 |
| 17.10.2020 | 61 | 73 | 53 |
| 16.10.2020 | 53 | 53 | 53 |
| 15.10.2020 | 53 | 53 | 53 |
© Bayerisches Landesamt für Umwelt 2024