
- Startseite >
- Flüsse >
- Wasserstand >
- Inn >
- Mühldorf >
- Jahresgrafik

Jahresgrafik Mühldorf / Inn
Wasserstand vom 22.11.2020 bis zum 21.11.2021
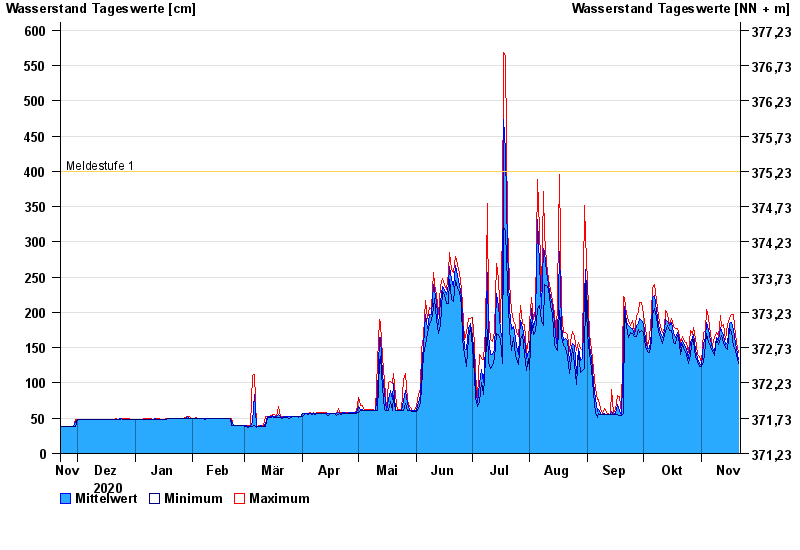
- Meldestufe 1 400 cm
- Hochwassergefahrenfläche HQ100 800 cm
| Datum | Mittelwert [cm] | Maximum [cm] | Minimum [cm] |
|---|---|---|---|
| 21.11.2021 | 133 | 143 | 128 |
| 20.11.2021 | 149 | 158 | 141 |
| 19.11.2021 | 165 | 181 | 150 |
| 18.11.2021 | 176 | 197 | 152 |
| 17.11.2021 | 186 | 197 | 173 |
| 16.11.2021 | 184 | 191 | 177 |
| 15.11.2021 | 158 | 183 | 147 |
© Bayerisches Landesamt für Umwelt 2024