
- Startseite >
- Flüsse >
- Wasserstand >
- Inn >
- Mühldorf >
- Jahresgrafik

Jahresgrafik Mühldorf / Inn
Wasserstand vom 20.01.2021 bis zum 19.01.2022
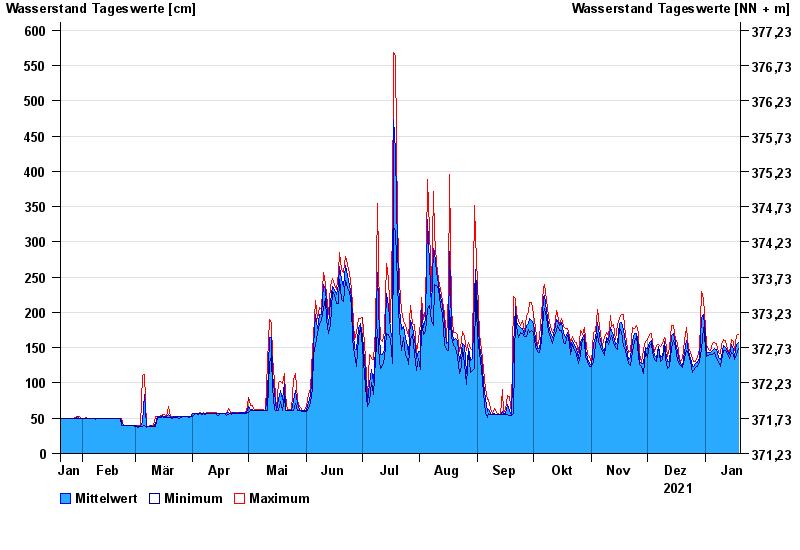
- 800 cm: Mühldorf: Innstrasse, beginnende Überflutung der Unterführung unter der B 12
| Datum | Mittelwert [cm] | Maximum [cm] | Minimum [cm] |
|---|---|---|---|
| 19.01.2022 | 157 | 169 | 149 |
| 18.01.2022 | 155 | 167 | 141 |
| 17.01.2022 | 138 | 146 | 133 |
| 16.01.2022 | 148 | 159 | 140 |
| 15.01.2022 | 154 | 161 | 143 |
| 14.01.2022 | 140 | 143 | 135 |
| 13.01.2022 | 144 | 148 | 140 |
© Bayerisches Landesamt für Umwelt 2024