
- Startseite >
- Flüsse >
- Wasserstand >
- Inn >
- Großschwindau >
- Jahresgrafik

Jahresgrafik Großschwindau / Goldach
Wasserstand vom 20.05.2022 bis zum 19.05.2023
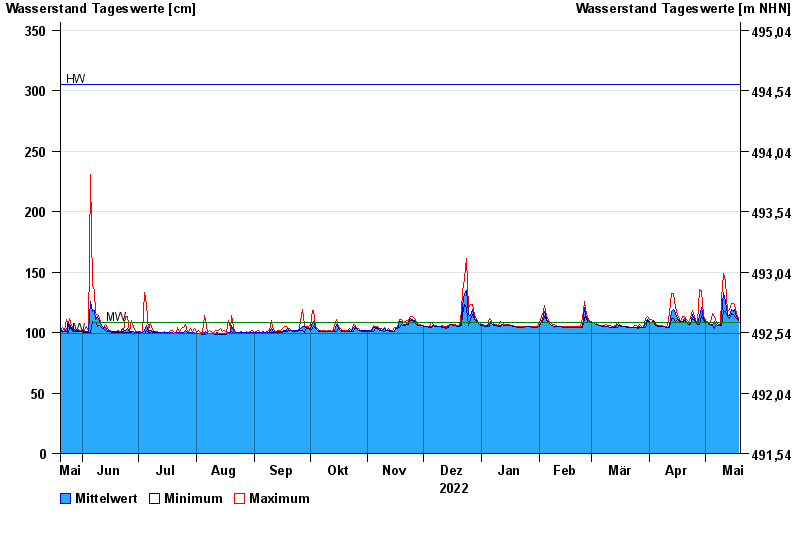
| Datum | Mittelwert [cm] | Maximum [cm] | Minimum [cm] |
|---|---|---|---|
| 19.05.2023 | 111 | 112 | 110 |
| 18.05.2023 | 113 | 116 | 112 |
| 17.05.2023 | 119 | 122 | 113 |
| 16.05.2023 | 117 | 124 | 115 |
| 15.05.2023 | 119 | 124 | 116 |
| 14.05.2023 | 114 | 119 | 112 |
| 13.05.2023 | 115 | 117 | 113 |
© Bayerisches Landesamt für Umwelt 2024