
- Startseite >
- Flüsse >
- Wasserstand >
- Inn >
- Feldolling >
- Jahresgrafik

Jahresgrafik Feldolling / Mangfall
Wasserstand vom 26.02.2021 bis zum 25.02.2022
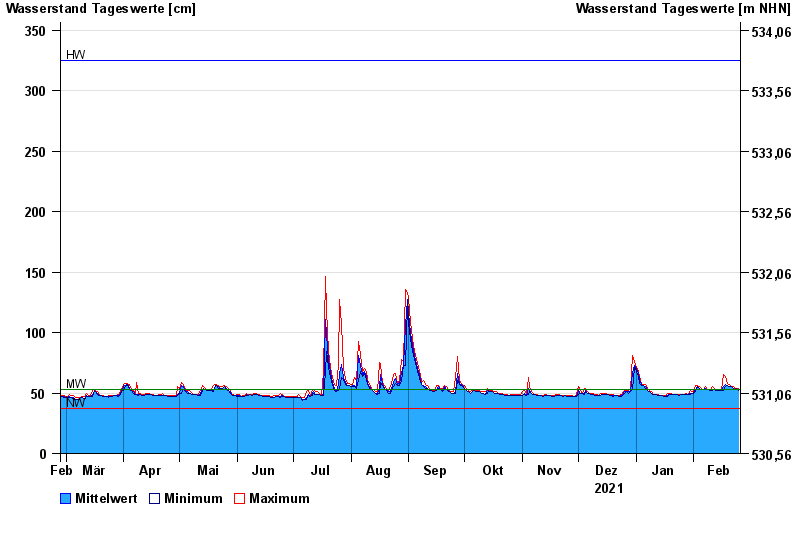
| Datum | Mittelwert [cm] | Maximum [cm] | Minimum [cm] |
|---|---|---|---|
| 25.02.2022 | 53 | 54 | 52 |
| 24.02.2022 | 54 | 54 | 54 |
| 23.02.2022 | 53 | 54 | 53 |
| 22.02.2022 | 54 | 55 | 54 |
| 21.02.2022 | 55 | 55 | 55 |
| 20.02.2022 | 55 | 57 | 55 |
| 19.02.2022 | 56 | 58 | 56 |
© Bayerisches Landesamt für Umwelt 2024