
- Startseite >
- Flüsse >
- Wasserstand >
- Inn >
- Engfurt >
- Jahresgrafik

Jahresgrafik Engfurt / Isen
Wasserstand vom 06.10.2021 bis zum 05.10.2022
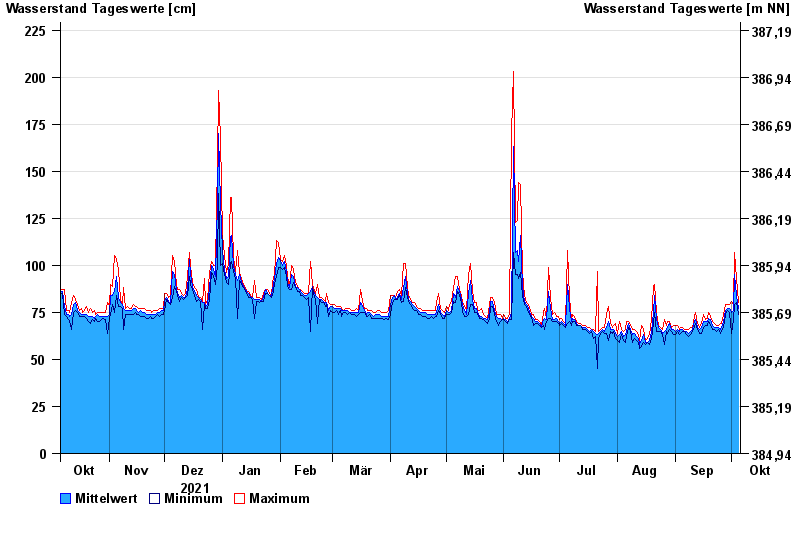
Hinweis
zeitweise Beeinflussung durch Kraftwerksbetrieb möglich
- 02.02.1985 Wasserstand: 386 cm
- 31.01.1982 Wasserstand: 365 cm
- 03.08.1991 Wasserstand: 358 cm
- 02.06.2013 Wasserstand: 352 cm
- 02.03.1987 Wasserstand: 346 cm
| Datum | Mittelwert [cm] | Maximum [cm] | Minimum [cm] |
|---|---|---|---|
| 05.10.2022 | 77 | 80 | 74 |
| 04.10.2022 | 84 | 93 | 80 |
| 03.10.2022 | 95 | 107 | 79 |
| 02.10.2022 | 76 | 79 | 71 |
| 01.10.2022 | 75 | 81 | 64 |
| 30.09.2022 | 77 | 79 | 75 |
| 29.09.2022 | 77 | 79 | 76 |
© Bayerisches Landesamt für Umwelt 2024