
- Startseite >
- Flüsse >
- Wasserstand >
- Inn >
- Beyharting >
- Jahresgrafik

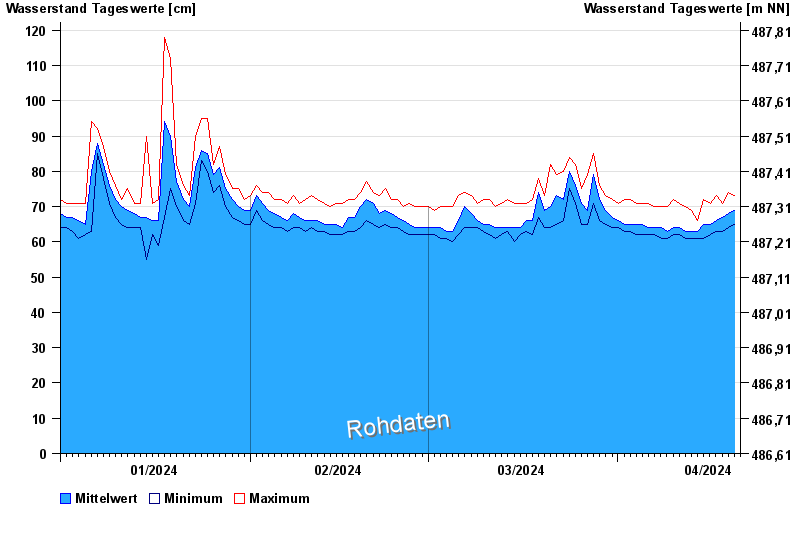
Jahresgrafik Beyharting / Glonn
Wasserstand vom 01.01.2024 bis zum 20.04.2024
 Für diesen Pegel sind keine Hochwassermarken hinterlegt.
| Datum | Mittelwert [cm] | Maximum [cm] | Minimum [cm] |
|---|---|---|---|
| 20.04.2024 | 69 | 73 | 65 |
| 19.04.2024 | 68 | 74 | 64 |
| 18.04.2024 | 67 | 71 | 63 |
| 17.04.2024 | 66 | 73 | 63 |
| 16.04.2024 | 65 | 71 | 62 |
| 15.04.2024 | 65 | 72 | 61 |
| 14.04.2024 | 63 | 66 | 61 |
© Bayerisches Landesamt für Umwelt 2024