
- Startseite >
- Flüsse >
- Wasserstand >
- Inn >
- Bad Kreuth >
- Jahresgrafik

Jahresgrafik Bad Kreuth / Sagenbach
Wasserstand vom 19.05.2022 bis zum 18.05.2023
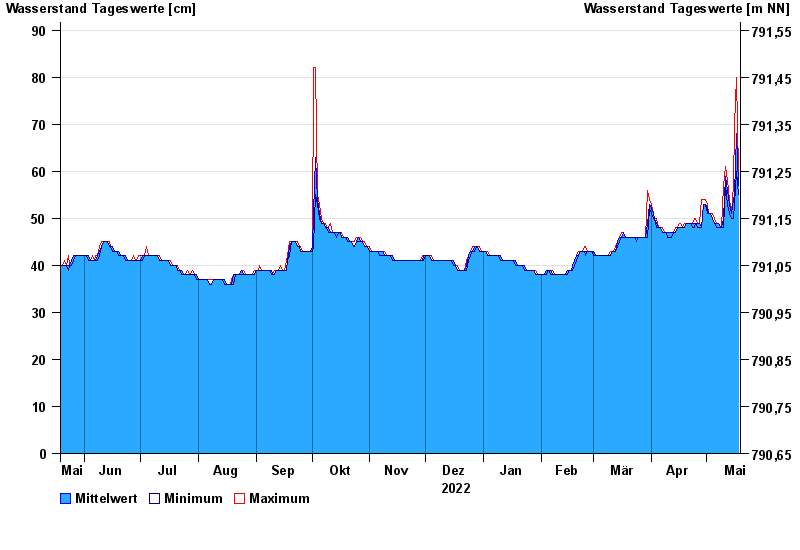
- Hochwassergefahrenfläche HQ100 140 cm
| Datum | Mittelwert [cm] | Maximum [cm] | Minimum [cm] |
|---|---|---|---|
| 18.05.2023 | 57 | 60 | 55 |
| 17.05.2023 | 68 | 80 | 60 |
| 16.05.2023 | 55 | 70 | 53 |
| 15.05.2023 | 54 | 57 | 50 |
| 14.05.2023 | 51 | 51 | 50 |
| 13.05.2023 | 53 | 54 | 51 |
| 12.05.2023 | 56 | 58 | 53 |
© Bayerisches Landesamt für Umwelt 2024