
- Startseite >
- Flüsse >
- Wasserstand >
- Inn >
- Bad Aibling >
- Jahresgrafik

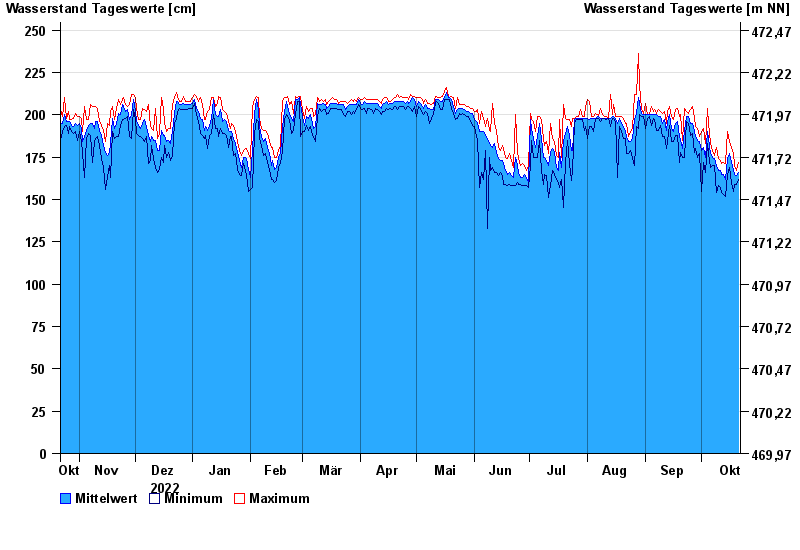
Jahresgrafik Bad Aibling / Triftbach linker Mühlkanal
Wasserstand vom 22.10.2022 bis zum 21.10.2023
 Für diesen Pegel sind keine Meldestufen hinterlegt.
| Datum | Mittelwert [cm] | Maximum [cm] | Minimum [cm] |
|---|---|---|---|
| 21.10.2023 | 166 | 172 | 162 |
| 20.10.2023 | 164 | 167 | 159 |
| 19.10.2023 | 165 | 170 | 159 |
| 18.10.2023 | 167 | 177 | 155 |
| 17.10.2023 | 172 | 181 | 160 |
| 16.10.2023 | 177 | 184 | 169 |
| 15.10.2023 | 174 | 190 | 165 |
© Bayerisches Landesamt für Umwelt 2024