
- Startseite >
- Flüsse >
- Wasserstand >
- Inn >
- Bad Aibling >
- Jahresgrafik

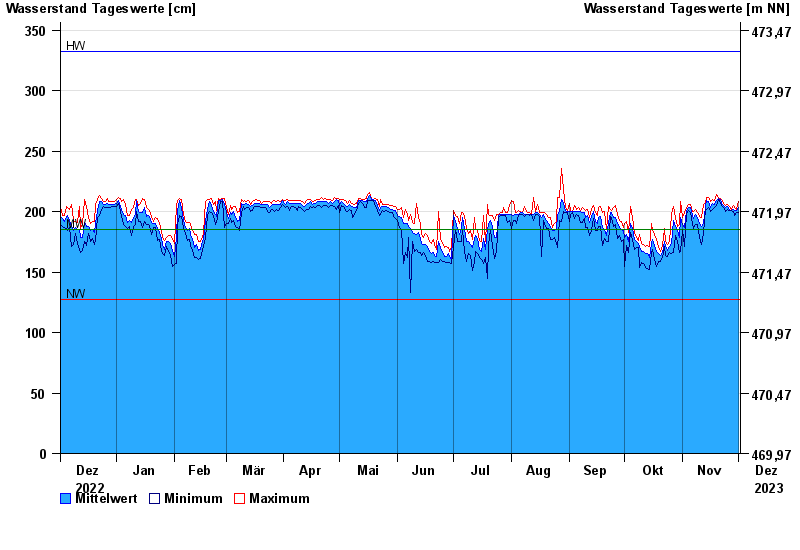
Jahresgrafik Bad Aibling / Triftbach linker Mühlkanal
Wasserstand vom 02.12.2022 bis zum 01.12.2023
| Datum | Mittelwert [cm] | Maximum [cm] | Minimum [cm] |
|---|---|---|---|
| 01.12.2023 | 203 | 208 | 199 |
| 30.11.2023 | 201 | 202 | 199 |
| 29.11.2023 | 201 | 203 | 197 |
| 28.11.2023 | 202 | 205 | 200 |
| 27.11.2023 | 201 | 202 | 201 |
| 26.11.2023 | 202 | 204 | 201 |
| 25.11.2023 | 204 | 206 | 202 |
© Bayerisches Landesamt für Umwelt 2024