
- Startseite >
- Flüsse >
- Wasserstand >
- Iller - Lech - Bodensee >
- Unterthingau >
- Jahresgrafik

Jahresgrafik Unterthingau / Kirnach
Wasserstand vom 30.05.2021 bis zum 29.05.2022
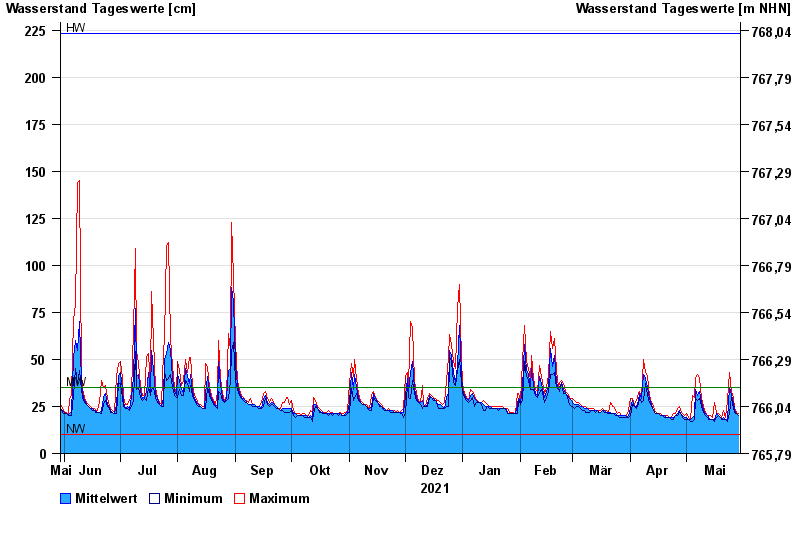
| Datum | Mittelwert [cm] | Maximum [cm] | Minimum [cm] |
|---|---|---|---|
| 29.05.2022 | 20 | 21 | 20 |
| 28.05.2022 | 21 | 22 | 21 |
| 27.05.2022 | 23 | 24 | 22 |
| 26.05.2022 | 27 | 30 | 24 |
| 25.05.2022 | 31 | 33 | 30 |
| 24.05.2022 | 35 | 43 | 22 |
| 23.05.2022 | 18 | 28 | 17 |
© Bayerisches Landesamt für Umwelt 2024