
- Startseite >
- Flüsse >
- Wasserstand >
- Iller - Lech - Bodensee >
- Unterthingau >
- Jahresgrafik

Jahresgrafik Unterthingau / Kirnach
Wasserstand vom 02.07.2022 bis zum 01.07.2023
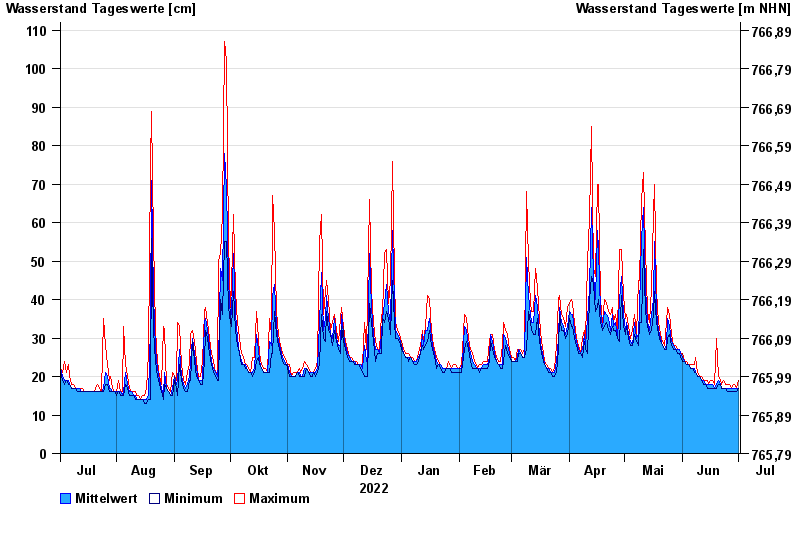
| Datum | Mittelwert [cm] | Maximum [cm] | Minimum [cm] |
|---|---|---|---|
| 01.07.2023 | 17 | 19 | 17 |
| 30.06.2023 | 17 | 17 | 16 |
| 29.06.2023 | 17 | 18 | 16 |
| 28.06.2023 | 17 | 18 | 16 |
| 27.06.2023 | 17 | 17 | 16 |
| 26.06.2023 | 17 | 18 | 16 |
| 25.06.2023 | 17 | 18 | 16 |
© Bayerisches Landesamt für Umwelt 2024