
- Startseite >
- Flüsse >
- Wasserstand >
- Iller - Lech - Bodensee >
- Türkheim >
- Jahresgrafik

Jahresgrafik Türkheim / Wertach
Wasserstand vom 26.08.2018 bis zum 25.08.2019
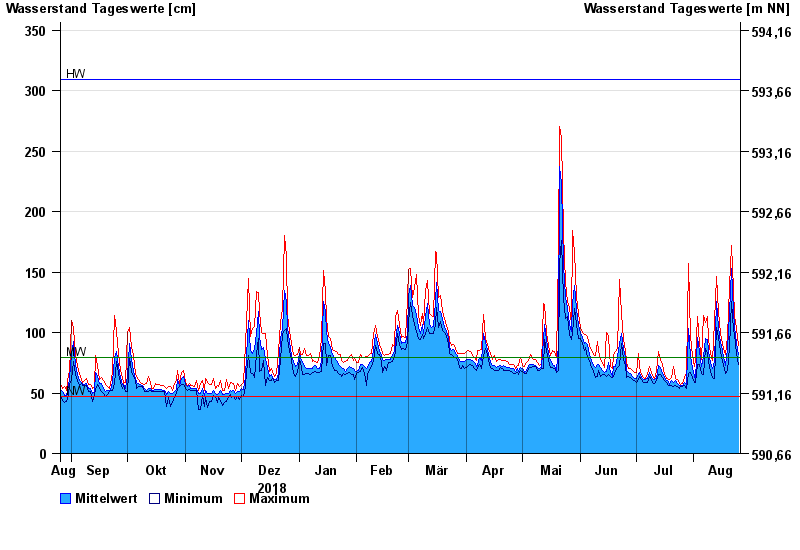
Hinweis
Beeinflussung durch Kraftwerksbetrieb
| Datum | Mittelwert [cm] | Maximum [cm] | Minimum [cm] |
|---|---|---|---|
| 25.08.2019 | 82 | 89 | 74 |
| 24.08.2019 | 91 | 103 | 83 |
| 23.08.2019 | 104 | 114 | 98 |
| 22.08.2019 | 117 | 136 | 102 |
| 21.08.2019 | 153 | 172 | 126 |
| 20.08.2019 | 116 | 138 | 88 |
| 19.08.2019 | 87 | 97 | 69 |
© Bayerisches Landesamt für Umwelt 2024