
- Startseite >
- Flüsse >
- Wasserstand >
- Iller - Lech - Bodensee >
- Türkheim >
- Jahresgrafik

Jahresgrafik Türkheim / Wertach
Wasserstand vom 25.09.2019 bis zum 24.09.2020
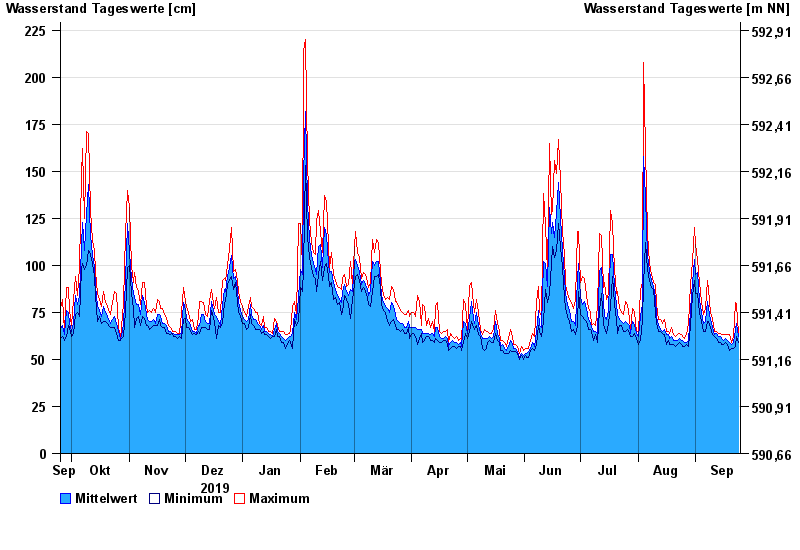
Hinweis
Beeinflussung durch Kraftwerksbetrieb
| Datum | Mittelwert [cm] | Maximum [cm] | Minimum [cm] |
|---|---|---|---|
| 24.09.2020 | 62 | 64 | 59 |
| 23.09.2020 | 69 | 79 | 62 |
| 22.09.2020 | 66 | 80 | 57 |
| 21.09.2020 | 59 | 62 | 56 |
| 20.09.2020 | 58 | 59 | 56 |
| 19.09.2020 | 59 | 63 | 55 |
| 18.09.2020 | 60 | 63 | 58 |
© Bayerisches Landesamt für Umwelt 2024