
- Startseite >
- Flüsse >
- Wasserstand >
- Iller - Lech - Bodensee >
- Türkheim >
- Jahresgrafik

Jahresgrafik Türkheim / Wertach
Wasserstand vom 21.06.2021 bis zum 20.06.2022
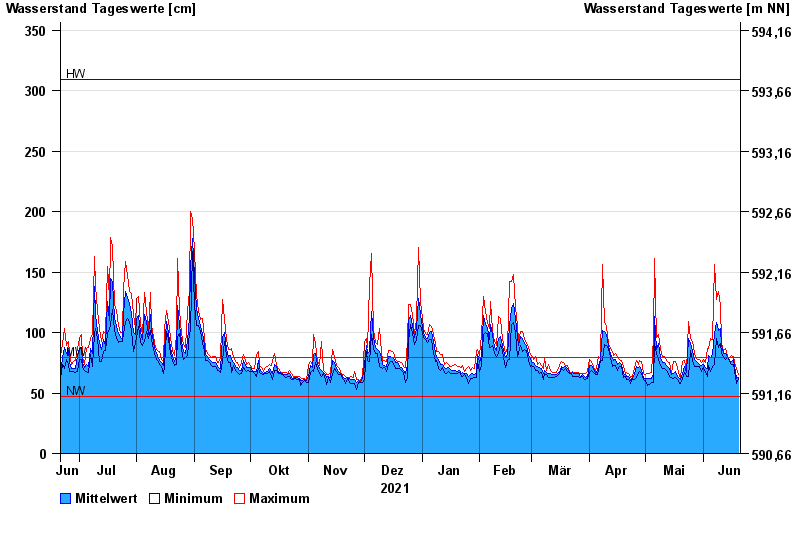
Hinweis
Beeinflussung durch Kraftwerksbetrieb
| Datum | Mittelwert [cm] | Maximum [cm] | Minimum [cm] |
|---|---|---|---|
| 20.06.2022 | 63 | 65 | 62 |
| 19.06.2022 | 62 | 70 | 58 |
| 18.06.2022 | 72 | 75 | 69 |
| 17.06.2022 | 78 | 80 | 74 |
| 16.06.2022 | 76 | 81 | 74 |
| 15.06.2022 | 77 | 79 | 76 |
| 14.06.2022 | 80 | 80 | 79 |
© Bayerisches Landesamt für Umwelt 2024