
- Startseite >
- Flüsse >
- Wasserstand >
- Iller - Lech - Bodensee >
- Roth >
- Jahresgrafik

Jahresgrafik Roth / Roth
Wasserstand vom 01.01.2022 bis zum 31.12.2022
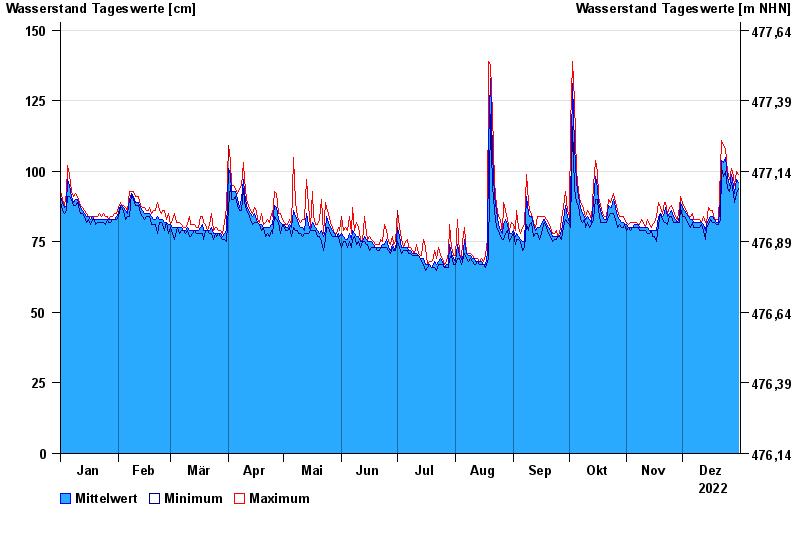
- 170 cm: Roth a.d. Roth: Umläufigkeit des Pegels
| Datum | Mittelwert [cm] | Maximum [cm] | Minimum [cm] |
|---|---|---|---|
| 31.12.2022 | 96 | 99 | 94 |
| 30.12.2022 | 97 | 100 | 92 |
| 29.12.2022 | 92 | 95 | 89 |
| 28.12.2022 | 95 | 98 | 92 |
| 27.12.2022 | 99 | 101 | 96 |
| 26.12.2022 | 95 | 97 | 93 |
| 25.12.2022 | 98 | 100 | 94 |
© Bayerisches Landesamt für Umwelt 2024