
- Startseite >
- Flüsse >
- Wasserstand >
- Iller - Lech - Bodensee >
- Oberaudorf >
- Jahresgrafik

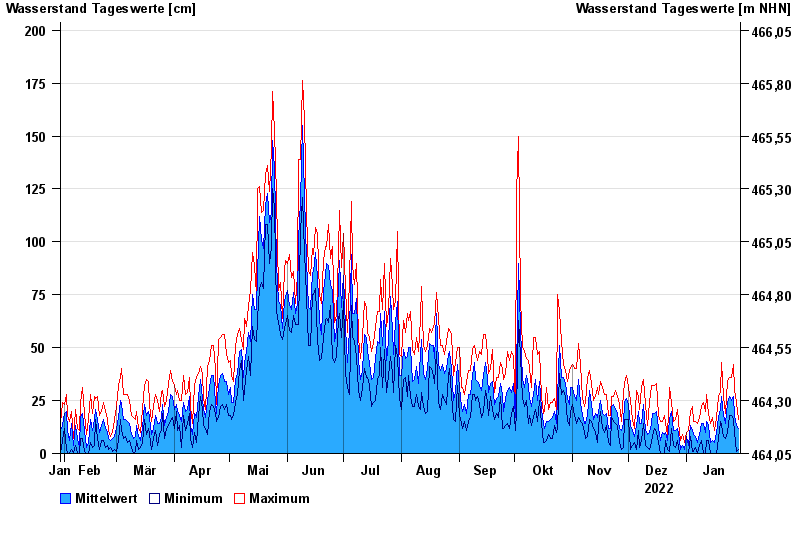
Jahresgrafik Oberaudorf / Inn
Wasserstand vom 30.01.2022 bis zum 29.01.2023
| Datum | Mittelwert [cm] | Maximum [cm] | Minimum [cm] |
|---|---|---|---|
| 29.01.2023 | 12 | 16 | 2 |
| 28.01.2023 | 13 | 24 | 1 |
| 27.01.2023 | 18 | 30 | 10 |
| 26.01.2023 | 27 | 42 | 16 |
| 25.01.2023 | 25 | 36 | 18 |
| 24.01.2023 | 27 | 36 | 18 |
| 23.01.2023 | 24 | 34 | 10 |
© Bayerisches Landesamt für Umwelt 2024