
- Startseite >
- Flüsse >
- Wasserstand >
- Iller - Lech - Bodensee >
- Lauben >
- Jahresgrafik

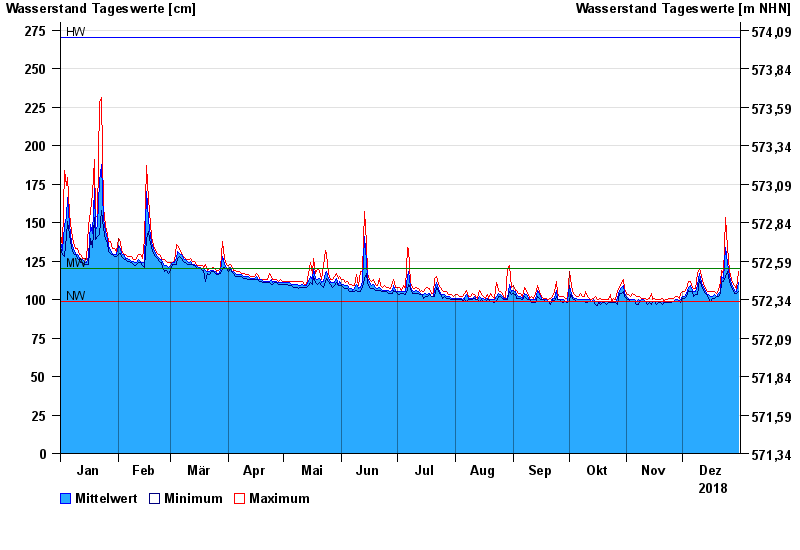
Jahresgrafik Lauben / Günz
Wasserstand vom 01.01.2018 bis zum 31.12.2018
| Datum | Mittelwert [cm] | Maximum [cm] | Minimum [cm] |
|---|---|---|---|
| 31.12.2018 | 111 | 118 | 105 |
| 30.12.2018 | 105 | 107 | 104 |
| 29.12.2018 | 106 | 109 | 104 |
| 28.12.2018 | 107 | 110 | 106 |
| 27.12.2018 | 110 | 113 | 108 |
| 26.12.2018 | 115 | 119 | 112 |
| 25.12.2018 | 124 | 134 | 118 |
© Bayerisches Landesamt für Umwelt 2024