
- Startseite >
- Flüsse >
- Wasserstand >
- Iller - Lech - Bodensee >
- Lauben >
- Jahresgrafik

Jahresgrafik Lauben / Günz
Wasserstand vom 25.10.2021 bis zum 24.10.2022
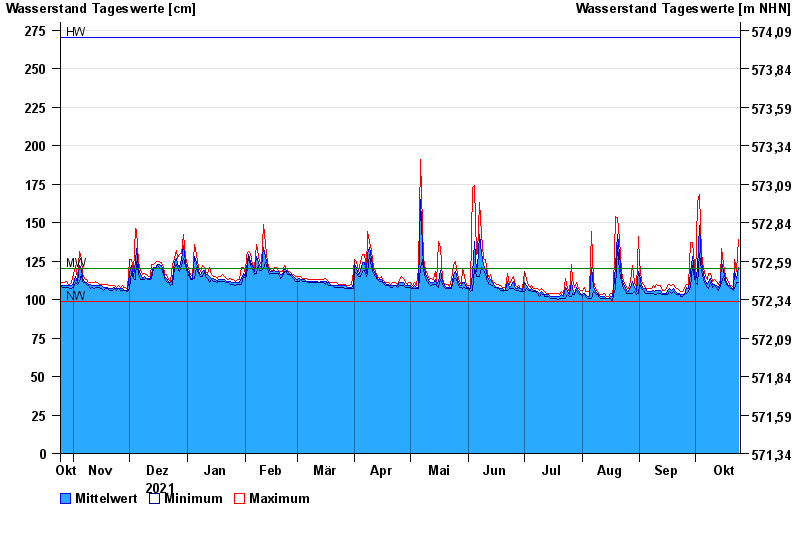
| Datum | Mittelwert [cm] | Maximum [cm] | Minimum [cm] |
|---|---|---|---|
| 24.10.2022 | 121 | 139 | 111 |
| 23.10.2022 | 114 | 118 | 111 |
| 22.10.2022 | 118 | 126 | 107 |
| 21.10.2022 | 107 | 108 | 106 |
| 20.10.2022 | 108 | 109 | 107 |
| 19.10.2022 | 109 | 110 | 108 |
| 18.10.2022 | 110 | 113 | 109 |
© Bayerisches Landesamt für Umwelt 2024