
- Startseite >
- Flüsse >
- Wasserstand >
- Iller - Lech - Bodensee >
- Gunzesried >
- Jahresgrafik

Jahresgrafik Gunzesried / Gunzesrieder Ach
Wasserstand vom 19.09.2020 bis zum 18.09.2021
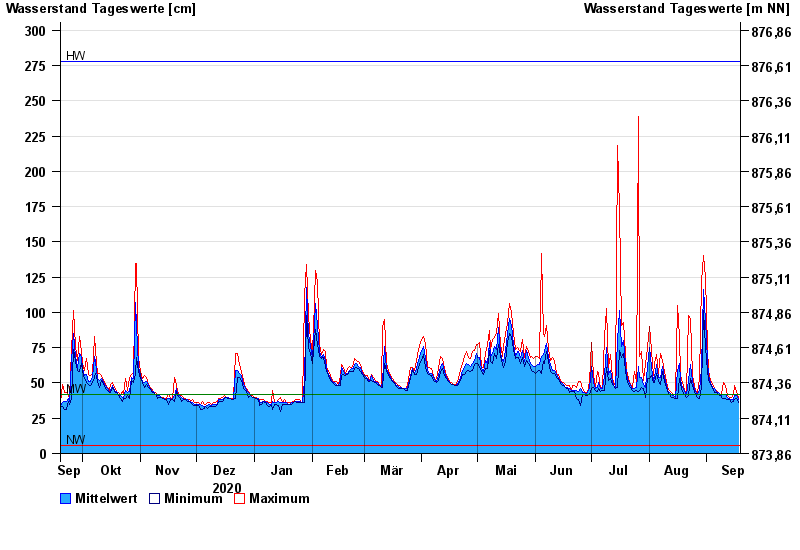
| Datum | Mittelwert [cm] | Maximum [cm] | Minimum [cm] |
|---|---|---|---|
| 18.09.2021 | 38 | 40 | 36 |
| 17.09.2021 | 41 | 44 | 39 |
| 16.09.2021 | 41 | 48 | 38 |
| 15.09.2021 | 38 | 42 | 37 |
| 14.09.2021 | 38 | 40 | 36 |
| 13.09.2021 | 39 | 40 | 38 |
| 12.09.2021 | 40 | 41 | 38 |
© Bayerisches Landesamt für Umwelt 2024