
- Startseite >
- Flüsse >
- Wasserstand >
- Iller - Lech - Bodensee >
- Görisried >
- Jahresgrafik

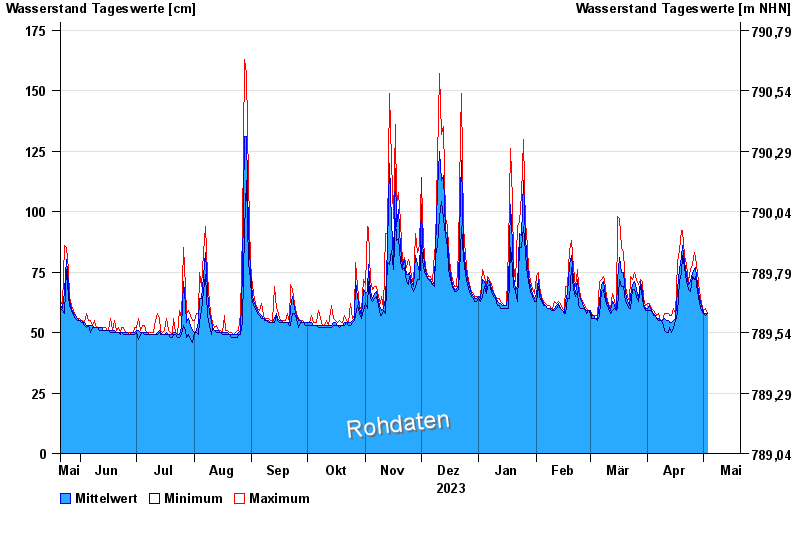
Jahresgrafik Görisried / Waldbach
Wasserstand vom 21.05.2023 bis zum 20.05.2024
| Datum | Mittelwert [cm] | Maximum [cm] | Minimum [cm] |
|---|---|---|---|
| 19.04.2024 | 80 | 92 | 75 |
| 18.04.2024 | 76 | 84 | 71 |
| 17.04.2024 | 68 | 79 | 58 |
| 16.04.2024 | 56 | 58 | 55 |
| 15.04.2024 | 55 | 60 | 52 |
| 14.04.2024 | 54 | 57 | 50 |
| 13.04.2024 | 54 | 57 | 52 |
© Bayerisches Landesamt für Umwelt 2024