
- Startseite >
- Flüsse >
- Wasserstand >
- Iller - Lech - Bodensee >
- Görisried >
- Jahresgrafik

Jahresgrafik Görisried / Waldbach
Wasserstand vom 17.06.2021 bis zum 16.06.2022
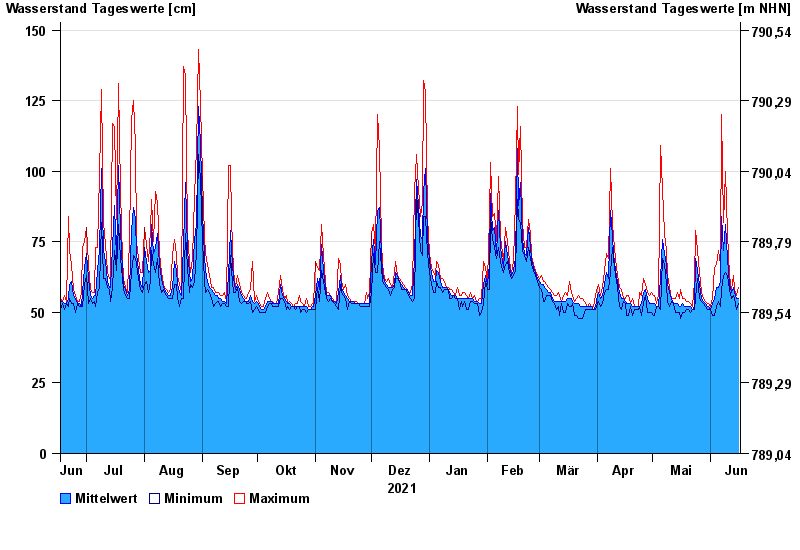
| Datum | Mittelwert [cm] | Maximum [cm] | Minimum [cm] |
|---|---|---|---|
| 16.06.2022 | 55 | 59 | 53 |
| 15.06.2022 | 55 | 56 | 51 |
| 14.06.2022 | 57 | 58 | 55 |
| 13.06.2022 | 59 | 63 | 56 |
| 12.06.2022 | 57 | 58 | 55 |
| 11.06.2022 | 60 | 63 | 58 |
| 10.06.2022 | 69 | 78 | 63 |
© Bayerisches Landesamt für Umwelt 2024