
- Startseite >
- Flüsse >
- Wasserstand >
- Iller - Lech - Bodensee >
- Fischach >
- Jahresgrafik

Jahresgrafik Fischach / Schmutter
Wasserstand vom 29.06.2022 bis zum 28.06.2023
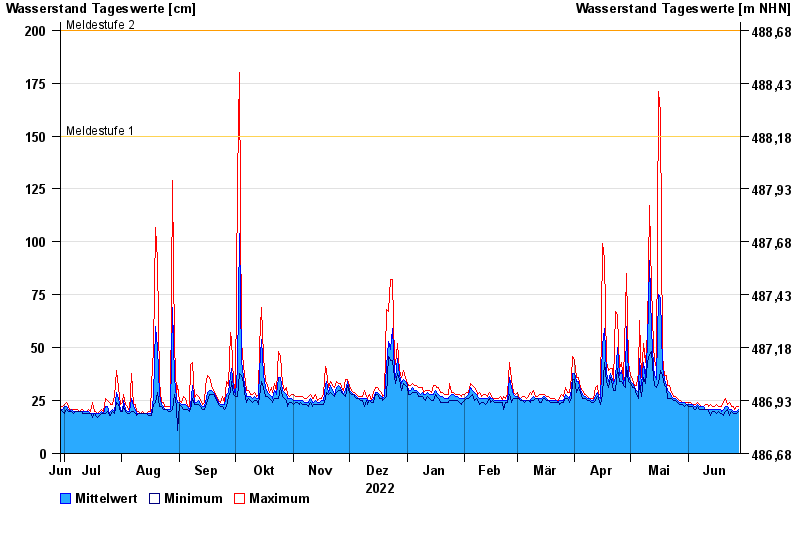
- Meldestufe 1 150 cm
- Meldestufe 2 200 cm
- Meldestufe 3 230 cm
- Meldestufe 4 260 cm
- Hochwassergefahrenfläche HQ100 310 cm
| Datum | Mittelwert [cm] | Maximum [cm] | Minimum [cm] |
|---|---|---|---|
| 28.06.2023 | 21 | 22 | 20 |
| 27.06.2023 | 20 | 22 | 19 |
| 26.06.2023 | 20 | 21 | 19 |
| 25.06.2023 | 20 | 22 | 19 |
| 24.06.2023 | 21 | 22 | 20 |
| 23.06.2023 | 21 | 24 | 18 |
| 22.06.2023 | 22 | 23 | 21 |
© Bayerisches Landesamt für Umwelt 2024