
- Startseite >
- Flüsse >
- Wasserstand >
- Iller - Lech - Bodensee >
- Fischach >
- Jahresgrafik

Jahresgrafik Fischach / Schmutter
Wasserstand vom 01.07.2023 bis zum 30.06.2024
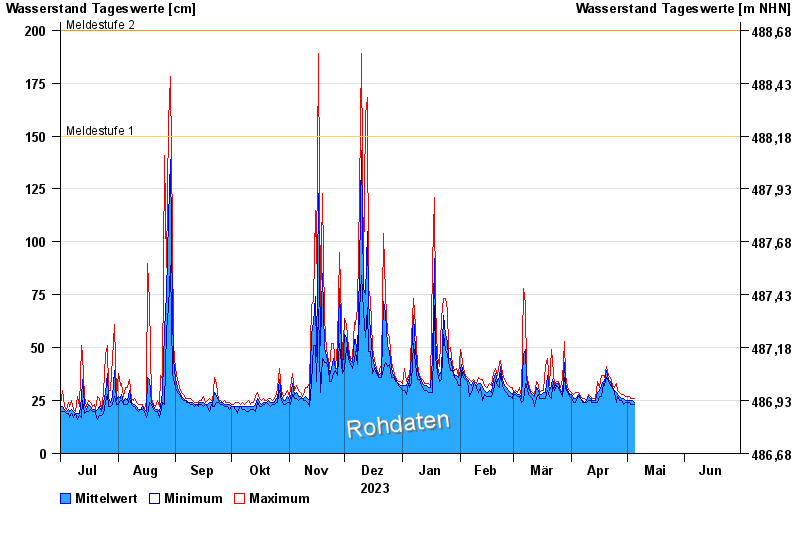
- Meldestufe 1 150 cm
- Meldestufe 2 200 cm
- Meldestufe 3 230 cm
- Meldestufe 4 260 cm
- Hochwassergefahrenfläche HQ100 310 cm
| Datum | Mittelwert [cm] | Maximum [cm] | Minimum [cm] |
|---|---|---|---|
| 26.04.2024 | 28 | 28 | 28 |
| 25.04.2024 | 29 | 33 | 24 |
| 24.04.2024 | 30 | 31 | 29 |
| 23.04.2024 | 31 | 32 | 31 |
| 22.04.2024 | 34 | 36 | 32 |
| 21.04.2024 | 35 | 37 | 34 |
| 20.04.2024 | 39 | 41 | 36 |
© Bayerisches Landesamt für Umwelt 2024