
- Startseite >
- Flüsse >
- Wasserstand >
- Iller - Lech - Bodensee >
- Eschach >
- Jahresgrafik

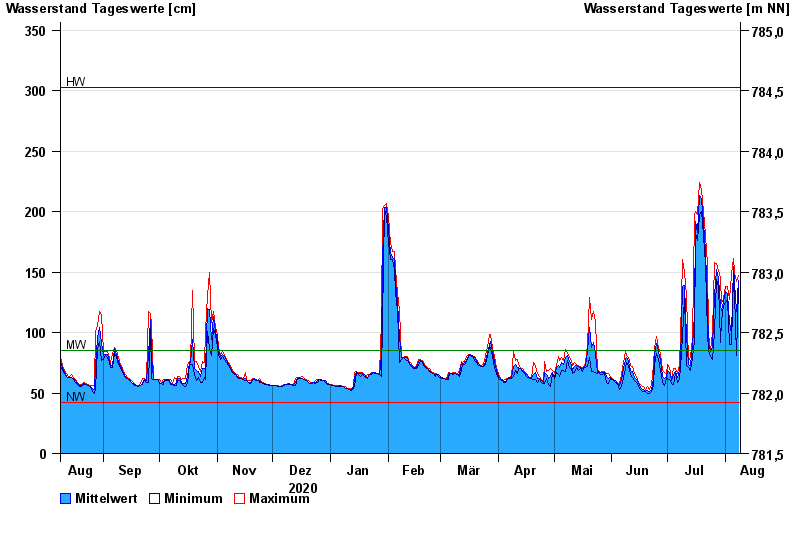
Jahresgrafik Eschach / Füssener Achen
Wasserstand vom 09.08.2020 bis zum 08.08.2021
| Datum | Mittelwert [cm] | Maximum [cm] | Minimum [cm] |
|---|---|---|---|
| 08.08.2021 | 143 | 147 | 137 |
| 07.08.2021 | 117 | 142 | 81 |
| 06.08.2021 | 141 | 150 | 132 |
| 05.08.2021 | 155 | 161 | 148 |
| 04.08.2021 | 99 | 148 | 90 |
| 03.08.2021 | 108 | 127 | 90 |
| 02.08.2021 | 132 | 138 | 127 |
© Bayerisches Landesamt für Umwelt 2024