
- Startseite >
- Flüsse >
- Wasserstand >
- Iller - Lech - Bodensee >
- Biessenhofen >
- Jahresgrafik

Jahresgrafik Biessenhofen / Wertach
Wasserstand vom 20.10.2021 bis zum 19.10.2022
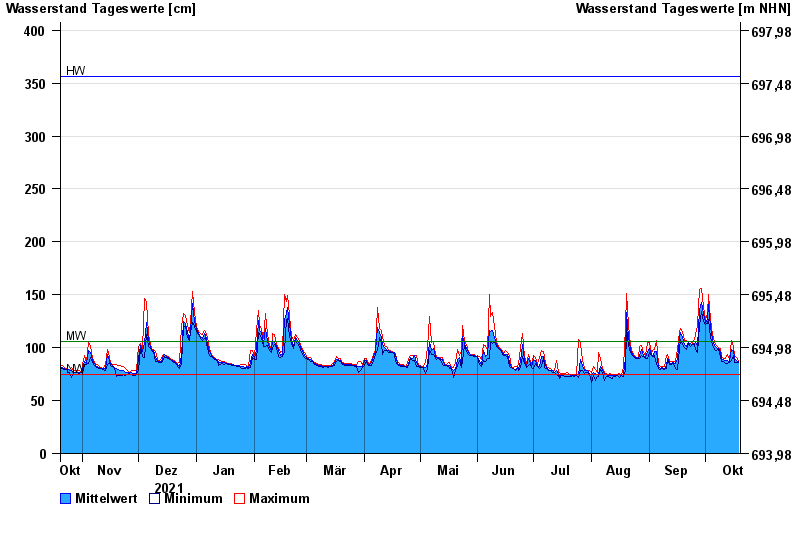
| Datum | Mittelwert [cm] | Maximum [cm] | Minimum [cm] |
|---|---|---|---|
| 19.10.2022 | 87 | 88 | 86 |
| 18.10.2022 | 88 | 91 | 86 |
| 17.10.2022 | 90 | 93 | 86 |
| 16.10.2022 | 97 | 101 | 93 |
| 15.10.2022 | 98 | 107 | 88 |
| 14.10.2022 | 87 | 89 | 86 |
| 13.10.2022 | 88 | 94 | 85 |
© Bayerisches Landesamt für Umwelt 2024