
- Startseite >
- Flüsse >
- Wasserstand >
- Iller - Lech - Bodensee >
- Aeschach >
- Jahresgrafik

Jahresgrafik Aeschach / Oberreitnauer Ach
Wasserstand vom 27.06.2023 bis zum 26.06.2024
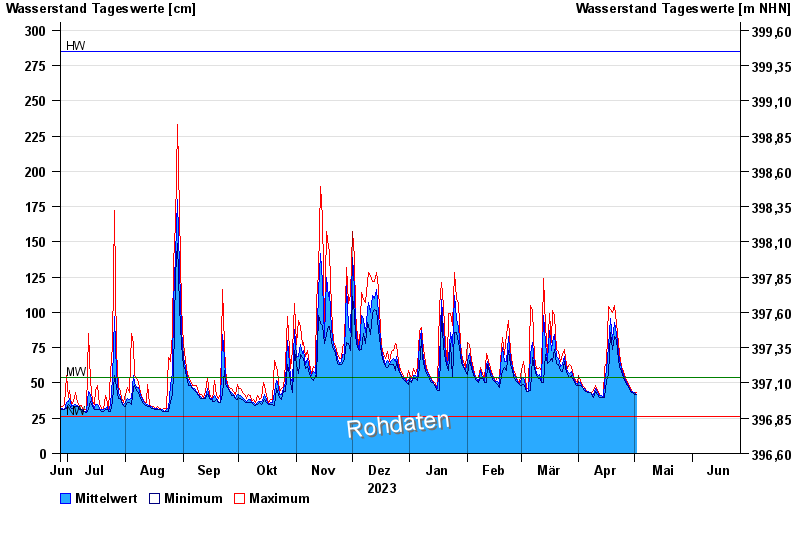
| Datum | Mittelwert [cm] | Maximum [cm] | Minimum [cm] |
|---|---|---|---|
| 19.04.2024 | 81 | 89 | 74 |
| 18.04.2024 | 96 | 102 | 86 |
| 17.04.2024 | 76 | 104 | 56 |
| 16.04.2024 | 59 | 64 | 52 |
| 15.04.2024 | 51 | 62 | 40 |
| 14.04.2024 | 40 | 40 | 40 |
| 13.04.2024 | 41 | 41 | 40 |
© Bayerisches Landesamt für Umwelt 2024