
- Startseite >
- Flüsse >
- Wasserstand >
- Oberer Main - Elbe >
- Schlehenmühle >
- Jahresgrafik

Jahresgrafik Schlehenmühle / Roter Main
Wasserstand vom 01.03.2019 bis zum 29.02.2020
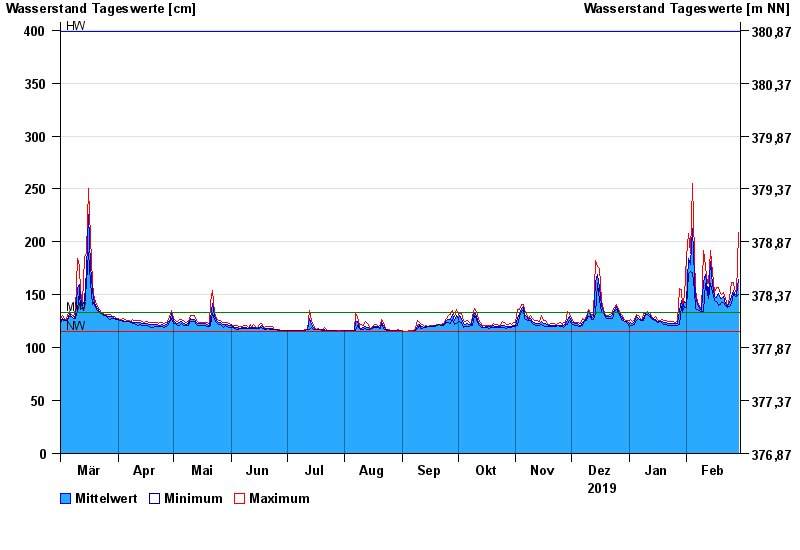
| Datum | Mittelwert [cm] | Maximum [cm] | Minimum [cm] |
|---|---|---|---|
| 29.02.2020 | 164 | 209 | 150 |
| 28.02.2020 | 149 | 151 | 148 |
| 27.02.2020 | 151 | 155 | 149 |
| 26.02.2020 | 154 | 162 | 151 |
| 25.02.2020 | 148 | 162 | 142 |
| 24.02.2020 | 143 | 146 | 139 |
| 23.02.2020 | 139 | 140 | 138 |
© Bayerisches Landesamt für Umwelt 2024