
- Startseite >
- Flüsse >
- Wasserstand >
- Oberer Main - Elbe >
- Pfarrweisach >
- Jahresgrafik

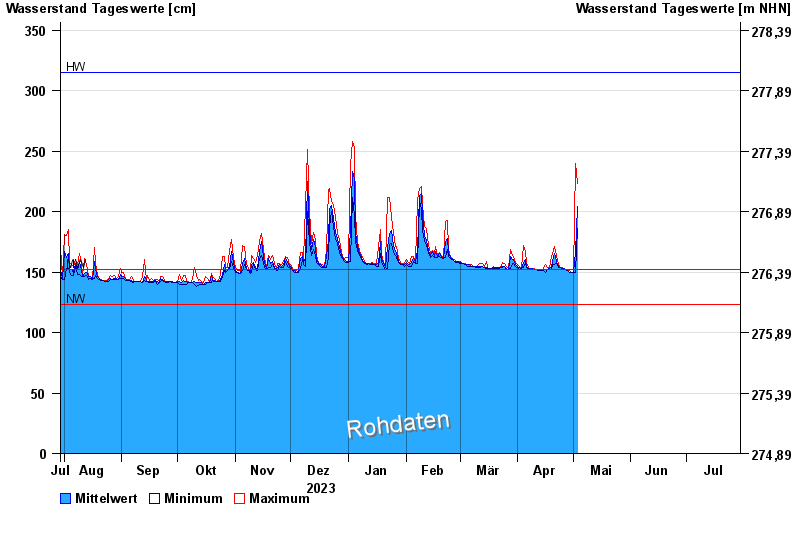
Jahresgrafik Pfarrweisach / Weisach
Wasserstand vom 30.07.2023 bis zum 29.07.2024
| Datum | Mittelwert [cm] | Maximum [cm] | Minimum [cm] |
|---|---|---|---|
| 20.04.2024 | 164 | 164 | 163 |
| 19.04.2024 | 155 | 163 | 152 |
| 18.04.2024 | 153 | 154 | 152 |
| 17.04.2024 | 152 | 154 | 152 |
| 16.04.2024 | 152 | 156 | 150 |
| 15.04.2024 | 151 | 153 | 151 |
| 14.04.2024 | 151 | 151 | 151 |
© Bayerisches Landesamt für Umwelt 2024