
- Startseite >
- Flüsse >
- Wasserstand >
- Oberer Main - Elbe >
- Pfarrweisach >
- Jahresgrafik

Jahresgrafik Pfarrweisach / Weisach
Wasserstand vom 30.07.2019 bis zum 29.07.2020
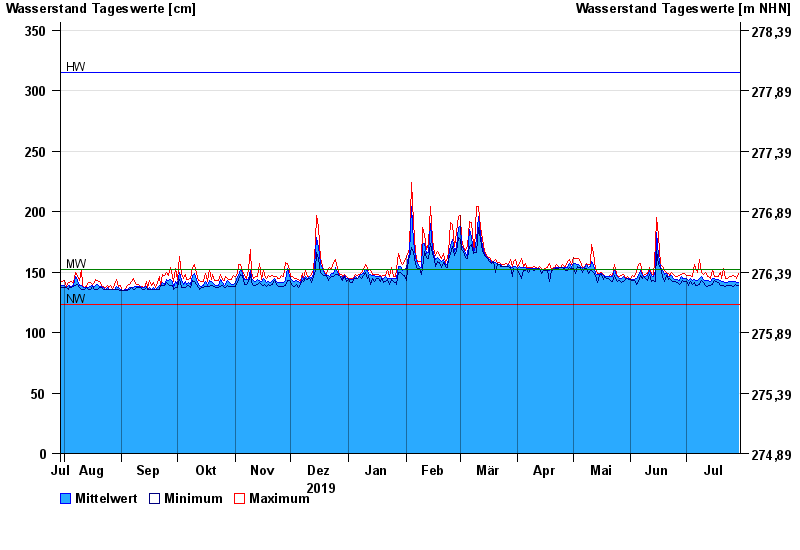
| Datum | Mittelwert [cm] | Maximum [cm] | Minimum [cm] |
|---|---|---|---|
| 29.07.2020 | 141 | 149 | 139 |
| 28.07.2020 | 141 | 145 | 139 |
| 27.07.2020 | 142 | 146 | 140 |
| 26.07.2020 | 142 | 147 | 138 |
| 25.07.2020 | 142 | 146 | 139 |
| 24.07.2020 | 142 | 146 | 139 |
| 23.07.2020 | 141 | 145 | 139 |
© Bayerisches Landesamt für Umwelt 2024