
- Startseite >
- Flüsse >
- Wasserstand >
- Oberer Main - Elbe >
- Pfarrweisach >
- Jahresgrafik

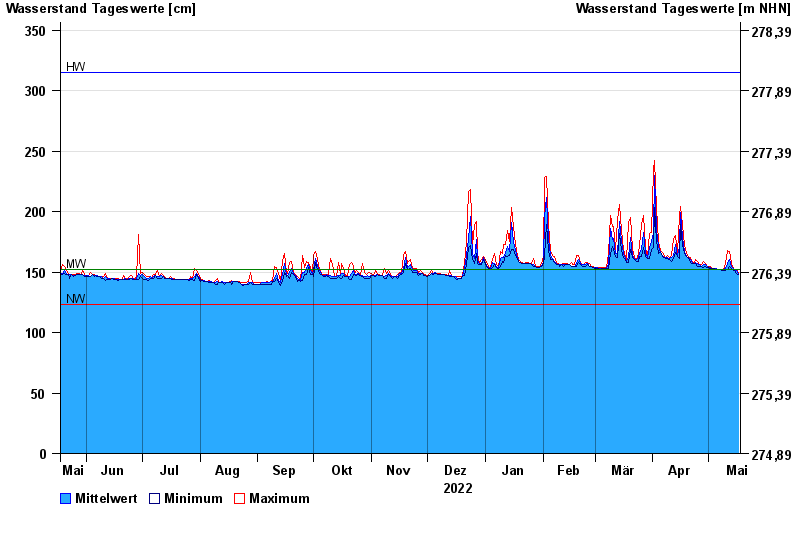
Jahresgrafik Pfarrweisach / Weisach
Wasserstand vom 18.05.2022 bis zum 17.05.2023
| Datum | Mittelwert [cm] | Maximum [cm] | Minimum [cm] |
|---|---|---|---|
| 17.05.2023 | 148 | 149 | 148 |
| 16.05.2023 | 151 | 152 | 149 |
| 15.05.2023 | 152 | 152 | 151 |
| 14.05.2023 | 153 | 153 | 151 |
| 13.05.2023 | 155 | 157 | 153 |
| 12.05.2023 | 160 | 167 | 155 |
| 11.05.2023 | 157 | 168 | 152 |
© Bayerisches Landesamt für Umwelt 2024