
- Startseite >
- Flüsse >
- Wasserstand >
- Oberer Main - Elbe >
- Neukenroth >
- Jahresgrafik

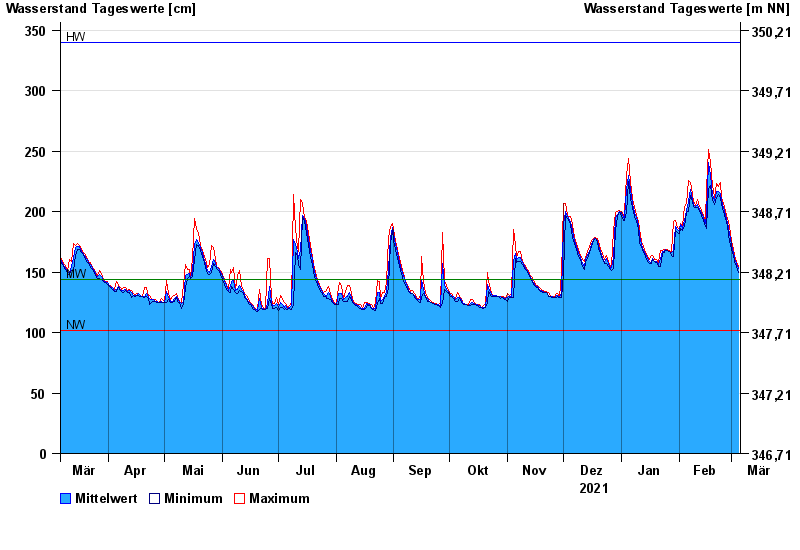
Jahresgrafik Neukenroth / Haßlach
Wasserstand vom 06.03.2021 bis zum 05.03.2022
| Datum | Mittelwert [cm] | Maximum [cm] | Minimum [cm] |
|---|---|---|---|
| 05.03.2022 | 153 | 155 | 150 |
| 04.03.2022 | 157 | 159 | 155 |
| 03.03.2022 | 161 | 164 | 159 |
| 02.03.2022 | 166 | 169 | 164 |
| 01.03.2022 | 172 | 176 | 169 |
| 28.02.2022 | 182 | 188 | 175 |
| 27.02.2022 | 191 | 194 | 188 |
© Bayerisches Landesamt für Umwelt 2024