
- Startseite >
- Flüsse >
- Wasserstand >
- Oberer Main - Elbe >
- Neukenroth >
- Jahresgrafik

Jahresgrafik Neukenroth / Haßlach
Wasserstand vom 01.01.2020 bis zum 31.12.2020
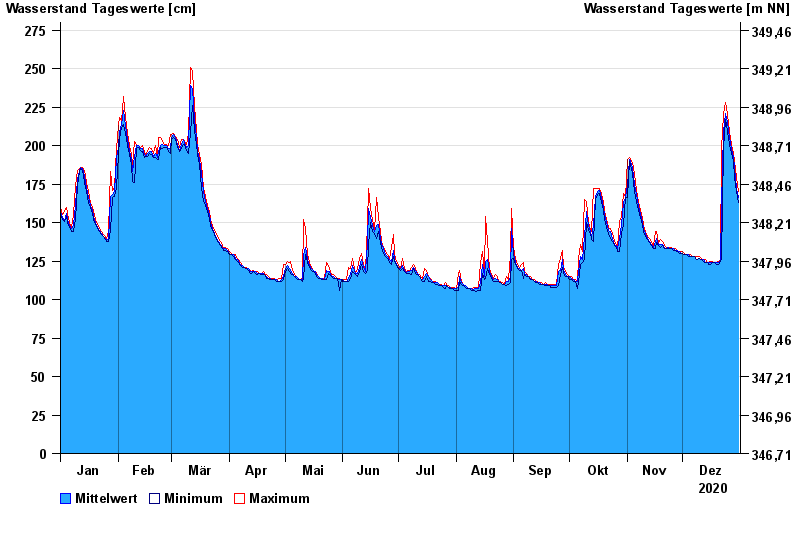
| Datum | Mittelwert [cm] | Maximum [cm] | Minimum [cm] |
|---|---|---|---|
| 31.12.2020 | 166 | 170 | 163 |
| 30.12.2020 | 172 | 179 | 170 |
| 29.12.2020 | 186 | 190 | 179 |
| 28.12.2020 | 192 | 195 | 190 |
| 27.12.2020 | 198 | 201 | 195 |
| 26.12.2020 | 205 | 209 | 201 |
| 25.12.2020 | 215 | 220 | 209 |
© Bayerisches Landesamt für Umwelt 2024