
- Startseite >
- Flüsse >
- Wasserstand >
- Oberer Main - Elbe >
- Michelfeld >
- Jahresgrafik

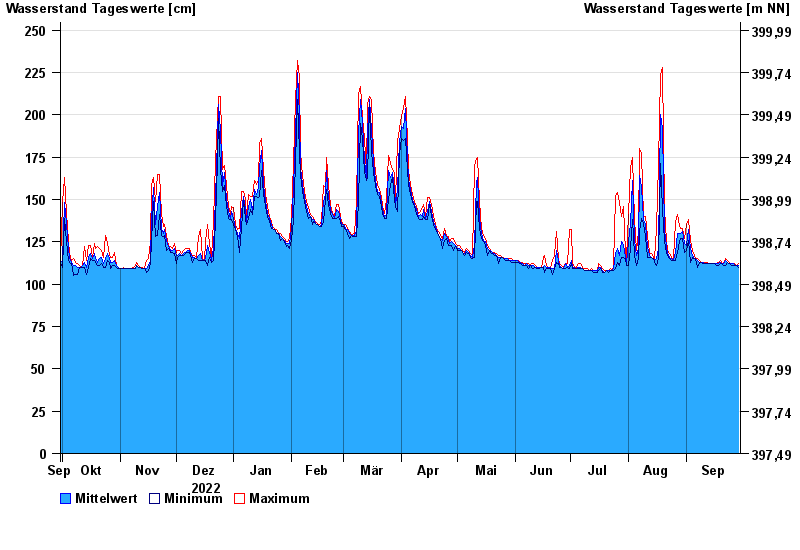
Jahresgrafik Michelfeld / Pegnitz
Wasserstand vom 30.09.2022 bis zum 29.09.2023
- 23.02.1970 Wasserstand: 300 cm
- 18.12.1974 Wasserstand: 255 cm
- 09.01.2011 Wasserstand: 253 cm
- 03.01.2003 Wasserstand: 252 cm
- 25.03.1970 Wasserstand: 252 cm
| Datum | Mittelwert [cm] | Maximum [cm] | Minimum [cm] |
|---|---|---|---|
| 29.09.2023 | 111 | 112 | 110 |
| 28.09.2023 | 111 | 111 | 111 |
| 27.09.2023 | 111 | 112 | 111 |
| 26.09.2023 | 112 | 112 | 111 |
| 25.09.2023 | 112 | 112 | 111 |
| 24.09.2023 | 112 | 113 | 112 |
| 23.09.2023 | 113 | 114 | 113 |
© Bayerisches Landesamt für Umwelt 2024